Over the past few months, as part of my self hosted finances series I’ve been working to extract all of my stock portfolio into some kind of self hosted database. I came across Ghostfolio, which is an open-source (with a paid hosted edition) tool for tracking stock portfolios. It was able to give me a portfolio view across multiple brokerages, automatically fetched stock prices, and gave some basic allocation reporting.
The problem
Ghostfolio doesn’t have any mechanism of actually knowing about your transactions and I don’t want to manually do it because that takes time and can have mistakes. Brokerages don’t expose this. Options like Plaid cost money and require extensive compliance requirements and don’t even provide all data that I need.
While some of banks provided CSV exports, that was rarely sufficient. That spawned a several month long project to see if I could build my own scraping to import it into Ghostfolio and centralize all my financial data into one place so I could perform analytics on it.
This led me on a multi month long project ot build tooling to synchronize my stock positions into Ghostfolio. I ended up building several web browser automation tools to just scrape what I need, however this quickly became a giant mess requiring a lot of work to figure out. I thought that working with bank and card transactions was hard, but stocks introduce an entirely new set of challenges.
In this post, I’m not even going to talk about how I implemented my scraping system, just the horrors I faced.
Terminology and Concepts
Before we can talk about complexity, let’s break down the concepts.
- Portfolio - The full set of current positions
- Current Position - The current # of shares of a given stock. This is the minimum information we need
- Cost Basis - The purchase price for all shares (now we have the profit)
- Stock Lot - A lot is a block of shares purchased on a given date and time with a given purchase price. Combined with cost basis, this gives us some useful insights for tax planning
- Realized gains/losses - A purchase and sale of a given stock lot
- Historical Activity - The history of buy, sell, and dividends. With this we now know how our returns over a given period of time
With just the positions, you can only know your account value. Adding cost basis means we now know the profit. Knowing the lots means you can now make tax planning decisions (for example is it better sell FIFO or the lot with the highest basis). Once you know the historical activity, you can now know the value of your account over time. Realized gains/losses gives you the historical profit.
What does Ghostfolio need?
Ghostfolio processes in terms of the buy, sell, dividend activity. i.e. I bought x shares on y date for z monies. Thus, the historical activity should be the best way to import data.
Limited activity data
Sounds easy, right? Whelp, unfortunately not every brokerage gives this information in this manner. Fidelity provides a CSV export of the activity, but only goes back 5 years. What happens if you have shares that are older than that? Using just the activity log, you’ll end up short in your portfolio.
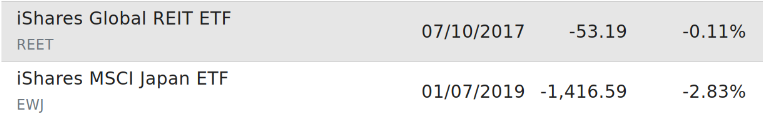
An incorrect short-position in Ghostfolio caused by the missing BUY side of the transaction because it’s >5 years old:
Betterment provides a dividends in CSV, lot level cost basis in CSV, and activity as a PDF. This is even more difficult because now you can’t identify any stock sales meaning that your portfolio incorrectly inflates upwards. In addition, it’ll incorrectly calculate historical account balances and assume you invested more money in later than you actually did. I request them to provide some useful every few years and they regularly say they don’t support it. Even though they clearly offer it through third-party aggregators like Plaid.
So here we have two different brokerages that provide completely different data offerings and none of them are actually usable.
Inferring it from other sources
Instead of looking just at one thing, the activity log, can we try to combine all the information the broker does provide us to infer the activity going back as far as possible?
For example, Fidelity has lot level realized gains going back 9 years, the current positions, open stock lots, in addition to the activity log. The current positions has a CSV download, but it only gives me a cost basis and current value, but I can’t figure out a BUY because I don’t know when that was purchased.
By open stock lots
The unrealized stock lots are available in the UI, but are server-side rendered as HTML (no friendly JSON or CSV) so I have to write a custom parser. Here’s the data it provides:
| Acquired | Term | $ Total Gain/Loss | % Total Gain/Loss | Current Value | Quantity | Average Cost Basis | Cost Basis Total |
|---|---|---|---|---|---|---|---|
| May-22-2015 | Long | $100.00 | +100% | $150 | 5 | $10 | $50 |
| Jan-1-2024 | Short | $5 | +5% | $10 | 1 | $5 | $5 |
Is that enough to tell Ghostfolio there was a BUY on May 22, 2015? Sort of, but there’s a foot-gun. It’s entirely possible to buy 10 shares of a stock and then sell 5 from that lot, so you’ve split the original purchase. If I have activity going back that includes the 2024 share purchase above, I have to recognize this and not create duplicate purchase records in Ghostfolio. I accidentally made this mistake before and then inflated my Ghostfolio.
By PDF statement
Fidelity offers PDF statements going back 10 years and Betterment provides activity events as PDF too. However, PDF is a terrible format to parse. There’s no DOM structuring like HTML. I adopted to use a Python package called PDFQuery to parse the PDFs and found out that you basically have to use bounding boxes to select text based on where it appears on the page. For example, in one brokerage, the doc looks like:
- Investment Details
- A table detailing the trades
- A bunch of legal disclaimers and notices
And to extract the table, I have to first find the text immediately before and after, then find those (x, y) coordinates, then find all the text in between those two lines and extract the table. Let’s hope they never change their disclaimer.
Even worse, institutions can and have regularly changed their page layouts over the years, so now you have to implement parsers depending on the years.
By realized gains
In Fidelity, I tried current positions and I tried the activity log and still got only partial data. What about the realized gains (i.e. closed positions on the UI)?
With this, we can see buy and sell transactions between the 5 and 10 year time range, but of course it has the same problem as the open tax lots, in that you have to ignore any transaction that you do have activity for to avoid a duplicate buy/sell. But of course this is only available as an entirely custom HTML table which requires browser automation to open the tabs and grab the table contents.
Rounding Bugs
Brokerage exports can give you information per share or total for the entire transaction. Ghostfolio takes the # of shares and the per share price, then multiplies number x share price = total price. If a data source gives me the transaction cost basis or value, then I have to do value / # of shares to get the per share price. That introduces error, especially if I try to match transactions.
For example, Betterment’s cost basis CSV export has:
| Shares | Cost Basis |
|---|---|
| 0.130046 | 13.81 |
| 0.131024 | 13.91 |
And the equivalent statements show:
| Statement | Price | Shares | Value |
|---|---|---|---|
| #1 | $106.27 | 0.130 | $13.82 |
| #2 | $106.24 | 0.131 | $13.92 |
We can clearly see that $13.81 is not equal to $13.82 or $13.92, so there’s clearly a difference in rounding in the CSV and the PDF statement. In addition, $13.81 / 0.130046 = 106.19319… which is not equal to $106.27 or $106.24.
Conclusion
In theory, if I combine all these different signals, I should be able reverse engineer most of the activity log at least for Fidelity, but good luck doing that across every institution and these institutions aren’t very interested in making this any easier. I email Betterment about some improvements that would make tax filing and extracting easier and each time they say not supported. Maybe I’ll rethink paying their management fee.