Importing and cleaning Mint transactions

This article is part of the Self-hosted Finances series.

    Since Intuit announced that Mint was going away, I’ve spent several months investigating how to import my Mint data into Firefly-iii, an open source, self-hosted budgeting software. It seemed like a perfect fit. I would fully own the data and get to build whatever tooling I want on top.

    However, before we can get there, we need to have cleaned and accurate data from Mint. As it turns out, Mint’s data actually had some errors in it that required me to go back years and fix them. In this post, I walk through the programmatic approach I took to identifying mistakes and fixing them.

    Downloading

    I previously talked about downloading data from Mint in Monarch Money and ad networks. Also download the daily balances. I also used the Monarch Money Data Exporter to download daily balance info.

    Understanding the Firefly model

    Importing into Firefly is tricky because it calculates the current balance of an account as the sum of all credits and debits. This is good in theory, but it requires you to have perfectly accurate transaction data going back to the account opening date. Most other tools, like Mint, Monarch, Personal Capital, all seem to track as a series of transactions and the balance is just collected from the bank and is not a function of the transactions. That’s easier to implement because it doesn’t require the full history and is robust against errors

    Additionally, Firefly-iii supports explicitly modelling transfers between two accounts. In effect, the two separate credit and debit transactions are linked together. This is problematic (and you’ll see why) because no bank actually tracks the opposite transaction, nor does Mint.

    Importing using the Firefly importer

    Firefly has a default importer. It’s a separate Docker container that enables you to import from a csv file.

    The importer has performance issues, doesn’t scale when loading large amounts of history. It would fail to load and crash when trying to do an entire year of transaction data.

    Data from Mint isn’t clean and has a few duplicates here and there.

    Identifying transfers is tough. It has no concept of being able to identify a transfer itself given two halves. The only way is to set remap the description as an opposing account, but descriptions aren’t consistent.

    For example, these are all transaction descriptions from Mint with different formats. I know they’re on the CAPITAL ONE side and I know which account they pull from, but I had to manually remap every single month:

    • CAPITAL ONE AUTOPAY PYMT AuthDate 09-Oct
    • CAPITAL ONE AUTOPAY PYMT AuthDate 09-Sep
    • CAPITAL ONE AUTOPAY payment AuthDate 05-N ov
    • CAPITAL ONE CRCARDPMT

    An ambiguous example:

    • Internet transfer from Interest Checking account
    • Internet transfer from Online Savings account

    Which account was it transferred from? This simply wasn’t going to work, so I gave up using the tool.

    Importing using Pandas

    Pandas is a popular Python package designed for data processing and manipulation and great for working with CSV files like this. It should be more scalable and able to handle these ambiguous cases.

    Loading

     1
     2
     3
     4
     5
     6
     7
     8
     9
    10
    11
    12
    13
    14
    15
    16
    17
    18
    19
    
    import pandas as pd
    
    transactions = pd.read_csv(f"/data/transactions.csv", parse_dates=['Date'], encoding='utf8').sort_values('Date').reset_index()
    transactions['Id'] = transactions.index
    
    # Map the Account Name column to the right Firefly account id
    account_map = {
      "Checking": 2087,
      # ...
    }
    
    transactions['AccountId'] = transactions['Account Name'].map(account_map)
    transactions[transactions['AccountId'].isnull()].groupby('Account Name').count()
    transactions = transactions[transactions['AccountId'].notnull()]
    transactions['AccountId'] = transactions['AccountId'].astype('int')
    
    transactions['AbsoluteAmount'] = transactions[['Amount', 'Transaction Type']].apply(lambda x: x['Amount'] if x['Transaction Type'] == 'credit' else -x['Amount'], axis=1)
    transactions['RunningBalance'] = transactions.sort_values('Date').groupby('Account Name')['AbsoluteAmount'].transform(pd.Series.cumsum)
    print(len(transactions))
    

    Comparing expected vs actual balances

    First, we need to check to see if Mint even has the right transactions (foreshadowing). Let’s compute the total balance based on all transactions:

    1
    2
    3
    4
    5
    6
    7
    8
    
    pd.set_option('max_colwidth', 200)
    pd.set_option('display.width', 200)
    pd.options.display.float_format = '{:20,.2f}'.format
    
    balances = transactions.groupby(['Account Name', 'Transaction Type'])['Amount'].sum().to_frame().reset_index().pivot(index='Account Name', columns='Transaction Type', values='Amount')
    balances['balance'] = balances['credit'] - balances['debit']
    
    print(balances)
    

    Next, load the balances as measured by Mint. The folder /data/mint-balances contains .csv files with the schema: Account Name,Date,Amount. I downloaded this using the Monarch Money Data Exporter before Mint shut down entirely.

    1
    2
    3
    4
    5
    6
    7
    
    import glob
    dfs = []
    for name in glob.glob('/data/mint-balances/*.csv'):
        dfs.append(pd.read_csv(name, parse_dates=['Date']))
    actual_balances = pd.concat(dfs, axis=0, ignore_index=True)
    
    current_balance = actual_balances.sort_values(by='Date', ascending=False).groupby('Account Name').first().drop(columns=['Date'])
    

    Join to find error

    1
    2
    3
    4
    5
    
    balance_combined = pd.merge(left=current_balance.rename(columns={'Amount': 'Actual'}), right=balances.rename(columns={'balance': 'Estimated'}), left_index=True, right_index=True)
    
    balance_combined['Error'] = balance_combined['Estimated'] - balance_combined['Actual']
    
    print(balance_combined.sort_values('Error')    'Estimated', 'Actual', 'Error']])
    

    Stock brokerage accounts I focused just on the cash based accounts (excluded anything with any type of security pricing such as brokerages, IRAs, etc.) and then compared the balances with the actual balances to find the balance error. In theory, if Mint were have collected data perfectly accurately, all error balances would be $0. However, it was not.

    Account Namebalanceactual_balancebalance_error
    A$4,000.0$2,000.0$2,000.0
    B$500.00$500.0$0.00
    C-$1,000.0$600.00-$400.00

    Unfortunately, errors are hard to track down because the error can come from anywhere.

    Duplicates

    One source is duplicated transactions. Duplicated transactions aren’t guaranteed to be bad, but could be. For example, if you pay with your phone at MTA, you’ll end up with a transaction for the same price for each ride.

    1
    2
    3
    
    transactions[transactions.duplicated(subset=['Date', 'Account Name', 'Amount', 'Transaction Type', 'Original Description'], keep=False)]
    
    # [98 rows x 12 columns]
    

    How you actually verify whether the duplicates are correct will vary. If you have access to the original statements (not likely if you’re past 7 years), then you’re going to have to use intuition. For example, I purchased something at a 0% financed rate. The payment is the same every month, so if there’s a duplicate, it’s wrong. My Capital One card allowed me to fetch any statements from the open date, my Citi and Amex cards required me to request transactions, and other cards I was out of luck.

    One account, like the “Account A/(Fidelity Cash Management)”, had an error of -$43.47. This was easy because I found a duplicate transaction:

    DateDescriptionTypeAmount
    9/25/2018Cash Withdrawaldebit43.47
    9/25/2018Cash Withdrawaldebit43.47

    Removing one from my .csv file brought the error for that account from -$43.47 to $0.00.

    Comparing balance over time to identify errors

    Once I identified which accounts showed errors, I compared the estimated balance vs the actual balance. The estimated balance is the cumulative sum of the credits and debits each day, and the actual balance is the daily balance as measured by Mint. This balance is collected when it scrapes the account so it should be accurate. Before this we compared just the ending balance, but this approach breaks it down as a time series which should help us narrow down to the exact date when an error is introduced.

     1
     2
     3
     4
     5
     6
     7
     8
     9
    10
    11
    12
    13
    14
    15
    16
    17
    18
    19
    20
    21
    
    import numpy as np
    from datetime import timedelta
    import matplotlib.pyplot as plt
    
    def render_bal_chart(acc_name):
        fig, ax = plt.subplots(figsize=(10, 5))
        ax.title.set_text('Difference in expected balance vs actual')
        ax.title.set_label('Date')
        ax.yaxis.set_label('$')
        
        actual_calc = actual_balances[actual_balances['Account Name'] == acc_name].set_index('Date')
        actual_calc['Change'] = actual_calc['Amount'].diff()
        actual = actual_calc[actual_calc['Change'] != 0]['Amount']
        estimated = transactions[transactions['Account Name'] == acc_name].groupby(['Date'])['RunningBalance'].sum()
        
        merge = pd.merge_asof(left=actual.rename('Actual'), right=estimated.rename('Estimated'), left_index=True, right_index=True, tolerance=timedelta(days=5), direction='backward')
        merge['Error'] = merge['Actual'] - merge['Estimated']
        
        ax.plot(merge['Error'])   
    
    render_bal_chart('Account Name')
    

    This next diagram shows the difference in the daily balance calculation.

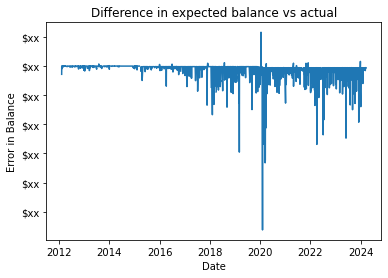
    This chart is very noisy and not helpful yet. But wait, let’s zoom in! There seems to be a noticeable pattern:

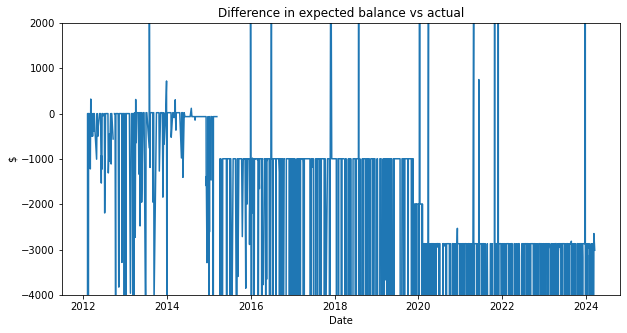
    As it turns out, the Mint collected account balance isn’t always right because 1) Mint doesn’t update every day and 2) pending transactions aren’t always included in the balance. To fix this, we can calculate a rolling average and drop out the error:

     1
     2
     3
     4
     5
     6
     7
     8
     9
    10
    11
    12
    13
    14
    15
    16
    17
    18
    19
    20
    21
    22
    23
    24
    25
    26
    27
    28
    29
    30
    31
    32
    33
    34
    35
    36
    37
    38
    39
    40
    41
    42
    43
    
    import numpy as np
    from datetime import timedelta
    import matplotlib.pyplot as plt
    
    def render_bal_chart(acc_name):
        fig, ax = plt.subplots(figsize=(10, 5))
        ax.title.set_text('Difference in expected balance vs actual')
        plt.xlabel('Date')
        plt.ylabel('$')
        
        actual_calc = actual_balances[actual_balances['Account Name'] == acc_name].set_index('Date')
        actual_calc['Change'] = actual_calc['Amount'].diff()
        actual = actual_calc[actual_calc['Change'] != 0]['Amount']
        estimated = transactions[transactions['Account Name'] == acc_name].groupby(['Date'])['RunningBalance'].sum()
        
        merge = pd.merge_asof(left=actual.rename('Actual'), right=estimated.rename('Estimated'), left_index=True, right_index=True, tolerance=timedelta(days=5), direction='backward')
        merge['Error'] = merge['Actual'] - merge['Estimated']
    
        # Denoise the signal
        rolling_mean = merge['Error'].rolling(5).mean()
        z_scores = np.abs(merge['Error'] - rolling_mean)
        df_filtered = merge[z_scores < 1]
        diff = df_filtered['Error'].diff()
        non_zero_indices = df_filtered[(diff > 1) | (diff < -1)].index
        
        indices = []
        # Include the previous value at each step
        for i in non_zero_indices:
            indices.append(df_filtered.index.get_loc(i) - 1)
    
        indices_to_include = df_filtered.index[[0, -1]].union(non_zero_indices).union(df_filtered.index[indices])
        ax.plot(df_filtered.loc[indices_to_include]['Error'], marker='.')
        
        for idx in indices:
            idiff = diff.index[idx]
            y = df_filtered.loc[idiff, 'Error']
            plt.text(idiff, y - 300, f"({idiff.strftime('%b %d')})", verticalalignment='bottom')
            
        for idx in non_zero_indices:
            idiff = diff.loc[idx]
            plt.text(idx, df_filtered.loc[idx, 'Error'], f"({idx.strftime('%b %d')}, {idiff:.2f}, {df_filtered.loc[idx, 'Error']:.2f})", verticalalignment='bottom')
    
    render_bal_chart('Account Name')
    

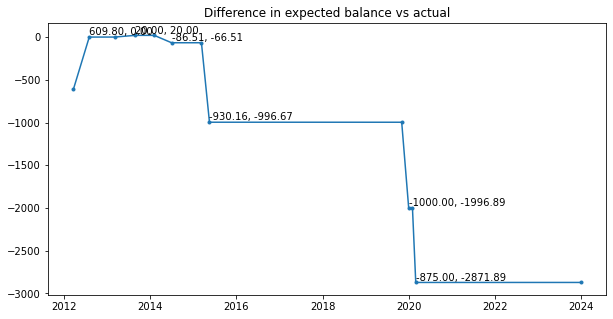
    Now I know to check between Mar 6th and April 26, 2013 for either an extra $20 credit or a missing $20 transaction. As it turns out there were two $20 credits. The same thing happened with the $1k difference in the end of 2019. This seems to be the common mistake.

    This method worked pretty well for cash based accounts, but trying to apply it to a credit card broke down because every transaction goes through a pending phase for a few days, far more than the cash accounts did. Even after tweaking the denoising algorithm, it still wasn’t able to find the error points even though I could very clearly see it with my eyes.

    I realized the most common failure point seems to be duplicated transactions, so can I specifically test for them? I came up with the following algorithm, first I identified all of the duplicated transactions, then it simulates removing one of the duplicates, if it reduces the error, it saves the transactions for further testing.

     1
     2
     3
     4
     5
     6
     7
     8
     9
    10
    11
    12
    13
    14
    15
    16
    17
    18
    19
    20
    21
    22
    23
    24
    25
    26
    27
    28
    29
    30
    31
    32
    33
    34
    35
    
    def render_bal_chart(acc_name: str):
        """
        Renders a chart showing the estimated balance and the correct balance for a single account.
    
        :param str acc_name: The account name as listed in the transactions.csv and the mint-balances.csv file
        """
        fig, (ax, ax2) = plt.subplots(2, figsize=(20, 20))
        ax.title.set_text(f'Difference in expected vs actual: {acc_name}')
        ax.xaxis.set_label('Date')
    
        applicable_transactions = transactions[transactions['Account Name'] == acc_name]
        
        actual_calc = actual_balances[actual_balances['Account Name'] == acc_name].set_index('Date')
        actual_calc['Change'] = actual_calc['Amount'].diff()
        actual = actual_calc[actual_calc['Change'] != 0]
        estimated = applicable_transactions.groupby(['Date'])['AbsoluteAmount'].sum().cumsum()
        
        merge = pd.merge(left=actual['Amount'].rename('Actual'), right=estimated.rename('Estimated'), left_index=True, right_index=True, how='inner', validate='one_to_one')
        merge['Error'] = merge['Actual'] - merge['Estimated']
         
        current_error = abs(merge['Error'].iloc[-1])
        legend_handles = []
        best_errors = []
        for index, duplicate in applicable_transactions[applicable_transactions.duplicated(subset=['Amount', 'Transaction Type', 'Date', 'Original Description'])].groupby(['Date', 'Transaction Type', 'Original Description']).agg(['count', 'sum', 'mean'])['Amount'].iterrows():
            date_key = duplicate.name[0]
            if duplicate.name[1] == 'debit':
                adj = -duplicate['mean']
            else:
                adj = duplicate['mean']
            test_s = merge['Error'].copy()
            test_s.loc[test_s.index > date_key] += adj
            new_error = abs(test_s[date_key:].mean())
            
            if new_error < current_error:
                best_errors.append({'error': test_s.abs().sum(), 'data': duplicate, 'adj': adj}) # Area under the curve
    

    Once it has a list of possibly incorrect duplicates ordered by how much it reduces the error, and iteratively simulates removing multiple transactions until it no-longer improves. These transactions are the ones that have a high likelihood of being invalid. To confirm, use your memory or check your statements.

     1
     2
     3
     4
     5
     6
     7
     8
     9
    10
    11
    12
    13
    14
    15
    16
    17
    18
    19
    20
    21
    
    best_errors = sorted(best_errors, key=lambda x: x['error'])
    new_df = merge['Error'].copy()
    current_error = new_df.abs().sum()
    convergence = [current_error]
    for best_error in best_errors:
        attempt = new_df.copy()
        date_key = best_error['data'].name[0]
        adj = best_error['adj']
        attempt.loc[date_key:] += adj
        new_error = attempt.abs().sum()
        if new_error < current_error:
            new_df = attempt
            current_error = new_error
            convergence.append(current_error)
            print(f"Found duplicate that when removed, reduced error: {date_key.strftime('%Y-%m-%d')}, tamount={adj},iamount={adj/duplicate['count']}")
            foo = ax.plot(new_df, label=f"Duplicate: {date_key.strftime('%Y-%m-%d')}, amount={best_error['data']['mean']}")[0]
            legend_handles.append(foo)
            ax.axvline(x=date_key, color=foo.get_color())
    
    ax2.title.set_text('Convergence of error')
    ax2.plot(convergence)
    

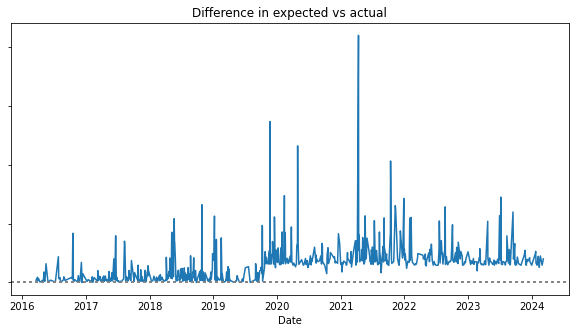
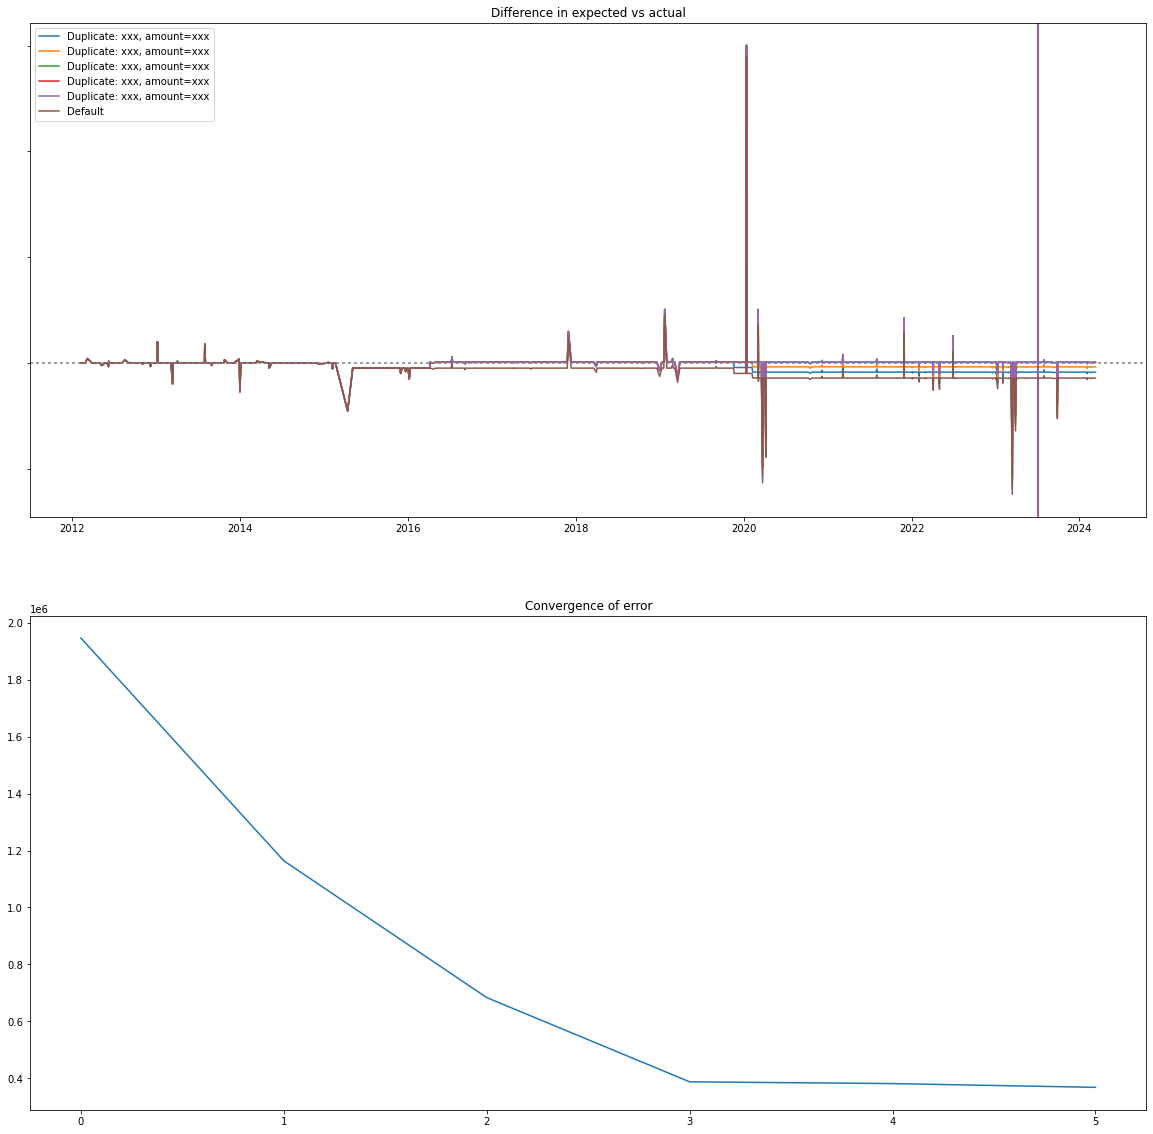
    Then finally render the simulations:

    1
    2
    3
    
    legend_handles.append(ax.plot(merge['Error'], label='Default')[0])
    ax.legend(handles=legend_handles)
    ax.axhline(y=0, color='grey', dashes=[2])
    

    Running this gets us the following. The second graph shows the error duplicates are removed (Lower is better). The first graph shows the default line along with the simulated removals. It’s a little hard to see, but at the very end, the error gets corrected back to 0 by removing the duplicates.

    Note, this may have false positives or false negatives. It’s calculating based on what looks right. However, it should give you some places to look. In my case, I looked at these transactions and deleted them from the CSV because they were wrong.

    Dummy Transactions

    The last strategy I employ is to just add dummy transactions to correct any errors. Find the earliest statement you can get for an account and see what the starting balance is. Then compare that with your estimated balance. Whatever the difference is can be added as an initial balance transaction.

    1
    2
    3
    4
    
    account = transactions[transactions['Account Name'] == 'General Fund'].sort_values('Date', ascending=True)
    
    first_known = account[(account['Date'] < '2016-01-01')].iloc[0][['Date', 'RunningBalance']]
    print(first_known)
    

    To calculate the initial balance, subtract the RunningBalance from the expected balance and create a manual transaction:

    1
    2
    3
    
    Date 2011-11-28 00:00:00
    RunningBalance 335.21
    Name: 16, dtype: object
    

    All Together

    If you want to see the (messy) code all together, take a look at the GitHub repo ajacques/own-your-finances.

    Next Steps & Conclusion

    Now, we should have a Pandas DataFrame containing cleaned and accurate transaction data. We identified multiple strategies to identify bad transaction data In Part 2, I’ll walk through how to identify the transfer pairs and actually import it into Firefly. At some point, I’ll figure out how to link this up to pull transaction data from accounts.

    If you’re in the United States, then you basically have no good options for accessing your data yourself without paying other companies (e.g. Plaid, Akoya) to screen scrape or integrate with restricted APIs. I’ll dive into this more in a later post, but this is why I’m very interested in the CFPB’s proposed rules on CFP1033. For awhile they were accepting public comments here, but that’s closed now.

    Errata

    • 2024-04-25 - Fix bug in render_bal_chart because I had an extra parameter that shouldn’t apply to other users. Added better validation.
    Copyright - All Rights Reserved
    Last updated on Apr 25, 2024 00:00 UTC

    Comments

    Comments are currently unavailable while I move to this new blog platform. To give feedback, send an email to adam [at] this website url.