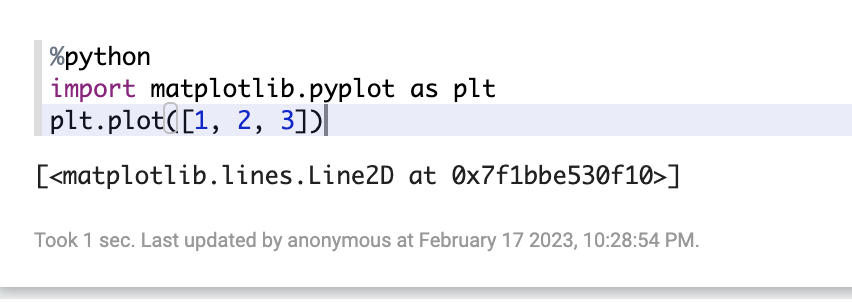
I upgraded to Apache Zeppelin v0.10.x from v0.9.x and randomly my Python Matplotlib scripts stopped rendering images. Anything that called the plot method would just return the string response of the function. Like below:
1
2
3
4
5
%python
import matplotlib.pyplot as plt
plt.plot([1, 2, 3])

[<matplotlib.lines.Line2D at 0x7ff547624210>]
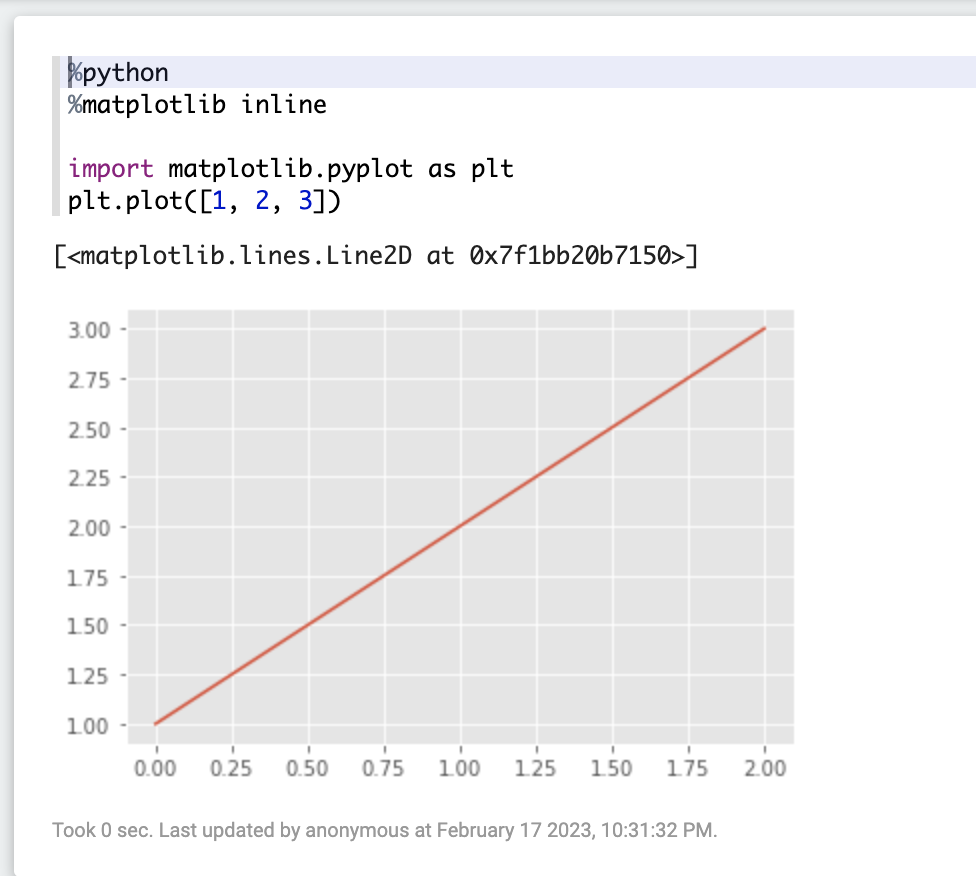
If this happens to you, just add the following directive after %python:
1
2
3
4
5
%python
%matplotlib inline

import matplotlib.pyplot as plt
plt.plot([1, 2, 3])
After that, it should work again:
I’m not sure why this seems to happen. After it’s applied it seems to apply to all future blocks too.
Comments
To give feedback, send an email to adam [at] this website url.
Donate
If you've found these posts helpful and would like to support this work directly, your contribution would be appreciated and enable me to dedicate more time to creating future posts. Thank you for joining me!