My external cluster runs on 3 different dedicated servers (most from SoYouStart.com.) I have 3 machines since the Kubernetes control plane needs 3 or more to be able to have a quorum and be able to handle any one machine going down. If one machine goes down, then the other two maintain a majority and can agree on the state of the cluster.
I randomly encountered issues where the Kubernetes control plane of Rancher UI would crash and restart. While this cluster didn’t really matter, it still annoyed me and wanted to figure it out.
I narrowed it down to one single host and documented the steps I took to resolve this issue which seems to be have been caused by one machine using HDDs and all other hosts using SSDs.
The Symptoms
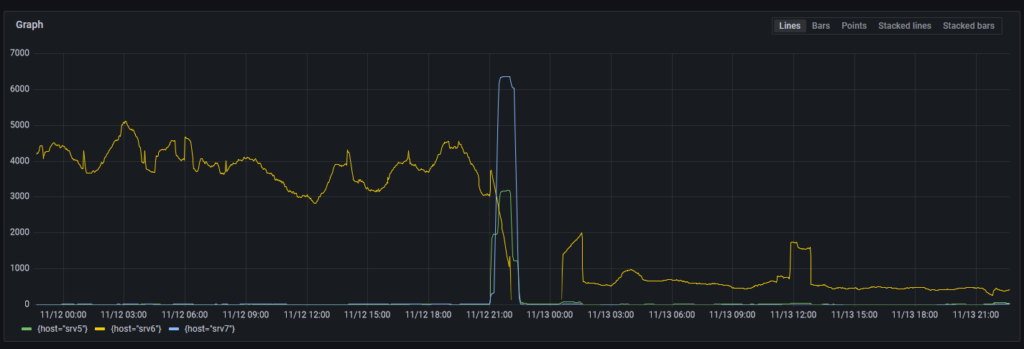
The first thing that I did was looked at all the hosts and noticed that one host (srv6) showed that a few Kubernetes control plane containers were restarting.
 1
 2
 3
 4
 5
 6
 7
 8
 9
10
11
12
13
14
| ccb77f64413b rancher/hyperkube:v1.24.4-rancher1 "/opt/rke-tools/entr…" 5 weeks ago Up 24 hours kube-proxy
08ec5c6161eb rancher/hyperkube:v1.24.4-rancher1 "/opt/rke-tools/entr…" 5 weeks ago Up 24 hours kubelet
88eaa48e458f rancher/hyperkube:v1.24.4-rancher1 "/opt/rke-tools/entr…" 5 weeks ago Up 15 hours kube-scheduler
4d603be7b4ef rancher/hyperkube:v1.24.4-rancher1 "/opt/rke-tools/entr…" 5 weeks ago Up 4 hours kube-controller-manager
dc86384410c2 rancher/hyperkube:v1.24.4-rancher1 "/opt/rke-tools/entr…" 5 weeks ago Up 24 hours kube-apiserver
05df16372b51 rancher/mirrored-coreos-etcd:v3.5.4 "/usr/local/bin/etcd…" 5 weeks ago Up 24 hours etcd
$ docker inspect kube-controller-manager
[
{
...
"State": {
"StartedAt": "2022-11-12T02:30:35.889344997Z",
"FinishedAt": "2022-11-12T02:30:31.970955836Z"
|
I was already running Grafana Loki, which aggregated all of my Docker container logs from all machines and zoomed into the time when the container last restarted:
{docker_container=~"/kube-apiserver|/kube-controller-manager"} |= ``
I scrolled through the logs and started seeing some smoke. A request to the kube-apiserver was timing out. kube-controller-manager calls kube-apiserver, which then calls etcd.
1
2
3
4
| 2022-11-11T18:30:25-08:00 E1112 02:30:25.799867 1 leaderelection.go:330] error retrieving resource lock kube-system/kube-controller-manager: Get "https://127.0.0.1:6443/apis/coordination.k8s.io/v1/namespaces/kube-system/leases/kube-controller-manager?timeout=5s": net/http: request canceled (Client.Timeout exceeded while awaiting headers)
...
2022-11-11T18:30:26-08:00 Trace[1355871407]: [5.002442529s] [5.002442529s] END
2022-11-11T18:30:26-08:00 E1112 02:30:26.701570 1 timeout.go:141] post-timeout activity - time-elapsed: 6.504883ms, GET "/apis/coordination.k8s.io/v1/namespaces/kube-system/leases/kube-controller-manager" result: <nil>
|
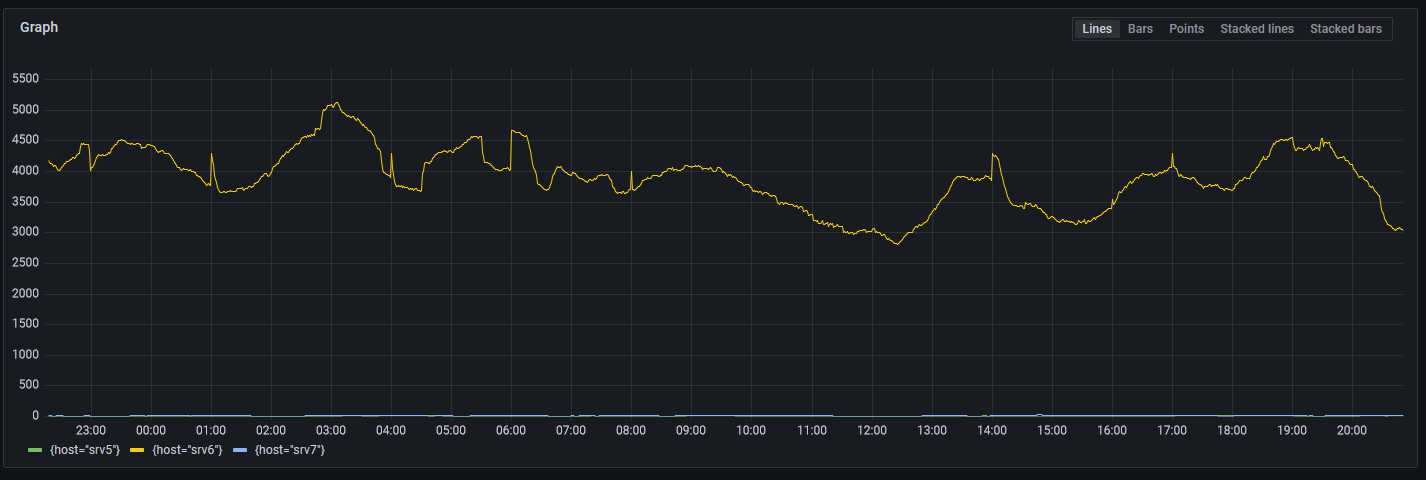
Looking in the etcd logs, I found some log statements saying “apply request took too long”. According to the etcd docs, this error statement is printed when the average time to write a change to disk exceeds 100ms. Since at least 2 hosts need to acknowledge a write for quorum, this caused these writes to slow down.
I searched across the hosts for this log statement and found that one particular host (srv6) gave this error far more than any other host.
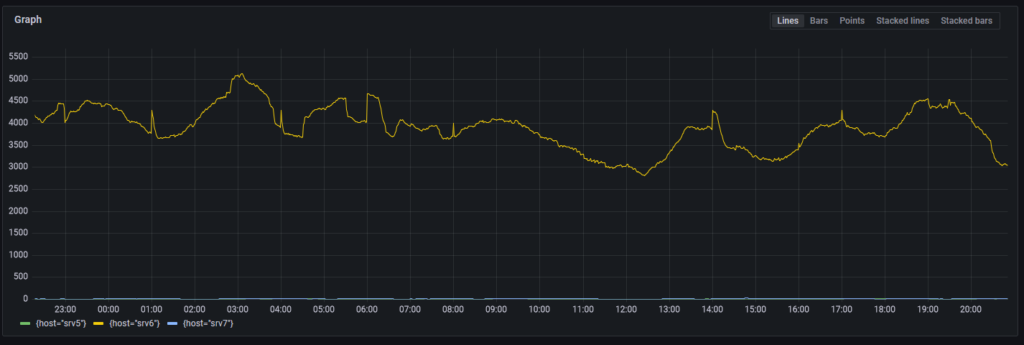
1
| sum by(host) (count_over_time({docker_container="/etcd"} |= `apply request took too long` [1h]))
|
The biggest difference between these hosts is that everything else has SSDs, but this one has spinning rust HDDs (4x 2TB HDDs in RAID1.) Is the hard drive dying?
Hard Drive Problems?
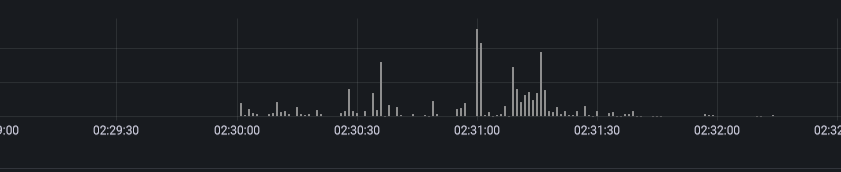
Next, I investigated further to see if there’s something wrong with the drives. The following Prometheus query gets the average write latency of I/O to the disk.
1
| sum by(instance) (increase(node_disk_write_time_seconds_total[1m])) / sum by(instance) (increase(node_disk_writes_completed_total[1m]))
|
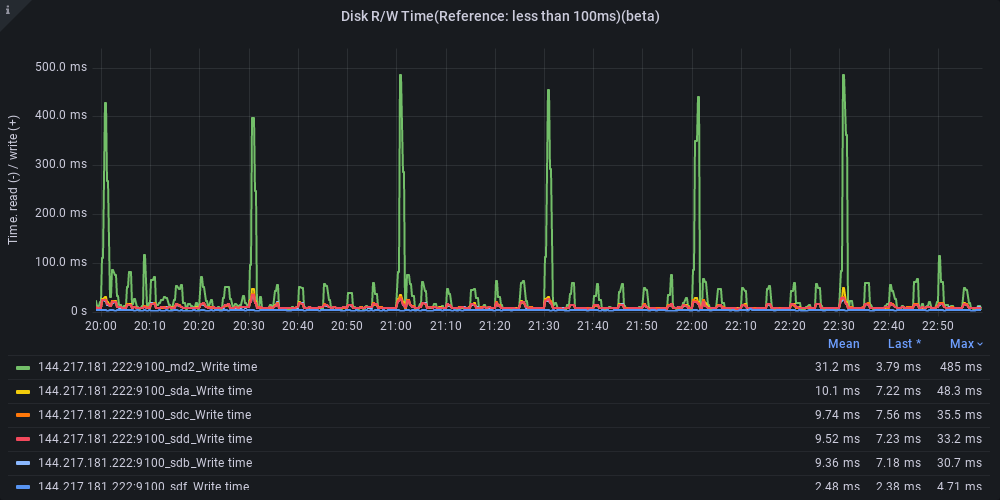
Here we see this host showing spikes in write latency every 30 minutes to the md2 disk, but my sd[a-d] drives show reasonable latency: <50ms. The md2 is a RAID1 array that mirrors to sda, sdb, sdc, and sdd.
A couple ideas come to mind:
There’s a spike every 30 minutes with smaller spikes every 5 minutes. Possibly caused by scheduled jobs
Only md2 is spiking, but sd[a-d] are not spiking as much. Not sure why the RAID virtual array spikes if the underlying drives are not seeing a similar spike.
Okay by what’s md2?
md2 is a Linux software RAID setup. It’s configured at RAID 1 across all 4 drives. When I first setup this machine, I didn’t put much thought into what kind of RAID setup I wanted, I just picked some default values in the server UI and this is what I ended up with.
 1
 2
 3
 4
 5
 6
 7
 8
 9
10
11
12
13
14
15
16
17
18
19
20
21
22
23
24
25
26
27
28
29
30
31
| mdadm --detail /dev/md2
/dev/md2:
Version : 1.2
Creation Time : Tue Dec 7 07:24:59 2021
Raid Level : raid1
Array Size : 1952332800 (1861.89 GiB 1999.19 GB)
Used Dev Size : 1952332800 (1861.89 GiB 1999.19 GB)
Raid Devices : 4
Total Devices : 4
Persistence : Superblock is persistent
Intent Bitmap : Internal
Update Time : Sun Nov 13 02:48:53 2022
State : active
Active Devices : 4
Working Devices : 4
Failed Devices : 0
Spare Devices : 0
Consistency Policy : bitmap
Name : md2
UUID : d49251e3:7091f035:ef641ea4:bff15c7f
Events : 78807
Number Major Minor RaidDevice State
0 8 34 0 active sync /dev/sdc2
1 8 50 1 active sync /dev/sdd2
2 8 2 2 active sync /dev/sda2
3 8 18 3 active sync /dev/sdb2
|
Checking SMART
Alright so nothing stands out in the RAID array yet. We can check the health of the drives using SMART using smartmontools.
 1
 2
 3
 4
 5
 6
 7
 8
 9
10
11
12
13
14
15
16
17
18
19
20
21
22
23
24
25
26
27
28
29
30
31
32
33
34
35
36
37
38
39
40
41
42
43
44
45
46
47
48
49
50
51
52
53
54
55
56
57
58
59
60
61
62
63
64
65
66
67
68
69
70
71
72
73
74
75
76
77
78
79
80
81
82
83
84
85
86
87
88
89
90
91
92
93
94
95
| sudo apt-get install smartmontools
sudo smartctl -a /dev/sda
smartctl 7.2 2020-12-30 r5155 [x86_64-linux-5.15.0-52-generic] (local build)
Copyright (C) 2002-20, Bruce Allen, Christian Franke, www.smartmontools.org
=== START OF INFORMATION SECTION ===
...
=== START OF READ SMART DATA SECTION ===
SMART overall-health self-assessment test result: PASSED
General SMART Values:
Offline data collection status: (0x84) Offline data collection activity
was suspended by an interrupting command from host.
Auto Offline Data Collection: Enabled.
Self-test execution status: ( 0) The previous self-test routine completed
without error or no self-test has ever
been run.
Total time to complete Offline
data collection: ( 24) seconds.
Offline data collection
capabilities: (0x5b) SMART execute Offline immediate.
Auto Offline data collection on/off support.
Suspend Offline collection upon new
command.
Offline surface scan supported.
Self-test supported.
No Conveyance Self-test supported.
Selective Self-test supported.
SMART capabilities: (0x0003) Saves SMART data before entering
power-saving mode.
Supports SMART auto save timer.
Error logging capability: (0x01) Error logging supported.
General Purpose Logging supported.
Short self-test routine
recommended polling time: ( 1) minutes.
Extended self-test routine
recommended polling time: ( 309) minutes.
SCT capabilities: (0x003d) SCT Status supported.
SCT Error Recovery Control supported.
SCT Feature Control supported.
SCT Data Table supported.
SMART Attributes Data Structure revision number: 16
Vendor Specific SMART Attributes with Thresholds:
ID# ATTRIBUTE_NAME FLAG VALUE WORST THRESH TYPE UPDATED WHEN_FAILED RAW_VALUE
1 Raw_Read_Error_Rate 0x000b 100 100 016 Pre-fail Always - 1
2 Throughput_Performance 0x0005 137 137 054 Pre-fail Offline - 79
3 Spin_Up_Time 0x0007 216 216 024 Pre-fail Always - 314 (Average 264)
4 Start_Stop_Count 0x0012 100 100 000 Old_age Always - 105
5 Reallocated_Sector_Ct 0x0033 100 100 005 Pre-fail Always - 0
7 Seek_Error_Rate 0x000b 100 100 067 Pre-fail Always - 0
8 Seek_Time_Performance 0x0005 142 142 020 Pre-fail Offline - 25
9 Power_On_Hours 0x0012 092 092 000 Old_age Always - 59245
10 Spin_Retry_Count 0x0013 100 100 060 Pre-fail Always - 0
12 Power_Cycle_Count 0x0032 100 100 000 Old_age Always - 104
192 Power-Off_Retract_Count 0x0032 100 100 000 Old_age Always - 225
193 Load_Cycle_Count 0x0012 100 100 000 Old_age Always - 225
194 Temperature_Celsius 0x0002 176 176 000 Old_age Always - 34 (Min/Max 20/52)
196 Reallocated_Event_Count 0x0032 100 100 000 Old_age Always - 0
197 Current_Pending_Sector 0x0022 100 100 000 Old_age Always - 0
198 Offline_Uncorrectable 0x0008 100 100 000 Old_age Offline - 0
199 UDMA_CRC_Error_Count 0x000a 200 200 000 Old_age Always - 0
SMART Error Log Version: 1
No Errors Logged
SMART Self-test log structure revision number 1
Num Test_Description Status Remaining LifeTime(hours) LBA_of_first_error
# 1 Short offline Completed without error 00% 51074 -
# 2 Short offline Completed without error 00% 51066 -
# 3 Short offline Completed without error 00% 51065 -
# 4 Short offline Completed without error 00% 51065 -
# 5 Short offline Completed without error 00% 51052 -
# 6 Short offline Completed without error 00% 51044 -
# 7 Short offline Completed without error 00% 51044 -
# 8 Short offline Completed without error 00% 51036 -
# 9 Short offline Completed without error 00% 51035 -
#10 Short offline Completed without error 00% 50512 -
#11 Short offline Completed without error 00% 50495 -
#12 Short offline Completed without error 00% 50487 -
SMART Selective self-test log data structure revision number 1
SPAN MIN_LBA MAX_LBA CURRENT_TEST_STATUS
1 0 0 Not_testing
2 0 0 Not_testing
3 0 0 Not_testing
4 0 0 Not_testing
5 0 0 Not_testing
Selective self-test flags (0x0):
After scanning selected spans, do NOT read-scan remainder of disk.
If Selective self-test is pending on power-up, resume after 0 minute delay.
Checking all four hosts didn't show any SMART concerns and said, while they're older, they're still healthy.
|
Scheduled Jobs?
What about the regular spikes on the clocks of every 30 minutes and smaller ones every 5 minutes. My host will be running scheduled jobs in Kubernetes and possibly in crontab. Let’s take a look at Kubernetes first:
 1
 2
 3
 4
 5
 6
 7
 8
 9
10
11
12
| kubectl --context=local get cronjobs --all-namespaces
NAMESPACE NAME SCHEDULE SUSPEND ACTIVE LAST SCHEDULE AGE
longhorn-system daily-backup 43 10 * * * False 0 16h 70d
longhorn-system weekly-backup 0 2 * * SUN False 0 53m 70d
test testjob */30 * * * * False 0 23m 237d
modtalk wordpress-cron */5 * * * * False 0 171m 119d
openzipkin zipkin-dependencies 25 5/6 * * * False 0 3h28m 82d
testjob regular-job 0 3/12 * * * False 0 11h 237d
sentry cleanup */5 * * * * False 0 168m 237d
sentry snuba-cleanup */5 * * * * False 0 8h 237d
sentry snuba-transactions-cleanup */5 * * * * False 0 8h 237d
technowizardry wordpress-cron */5 * * * * False 0 51m 237d
|
There were a number of jobs running every 5 minutes. I changed them to run less frequently and saw a reduction in write latency during the 5 minute spikes, but still saw spikes every time a CronJob ran.
Great so, the problem is because a CronJob starting is causing a large amount of disk I/O and slowing down writes for etcd.
Proposal
My hypothesis based on the above information is that the hard drives are getting overloaded with the amount of write or read write work meaning that higher priority I/O from Kubernetes’ etcd system is taking too long and is causing problems.
RAID1 will mirror the hard drive contents across all four hard drives. This is good for read performance since it can balance reads across all 4 drives, but writes slow down to the slowest drive. In a 4 drive system, this can be problematic.
Instead, I’m going to break the 4 drive mirror array into two, two-drive RAID1 arrays and move certain performance critical data to the second array and leave the first one for
Splitting RAID
Following a guide, I took out two drives from the existing array.
 1
 2
 3
 4
 5
 6
 7
 8
 9
10
11
12
13
14
15
16
17
18
19
20
21
22
23
24
25
26
27
28
29
30
31
32
33
34
35
36
37
38
39
40
41
42
43
44
45
46
47
48
49
50
51
52
53
54
55
56
57
58
59
60
61
62
63
64
65
66
67
68
69
70
71
72
73
74
75
76
77
78
79
80
81
82
83
84
85
86
87
88
| mdadm --manage /dev/md2 --fail /dev/sdc2
mdadm: set /dev/sdc2 faulty in /dev/md2
mdadm --manage /dev/md2 --fail /dev/sdd2
mdadm: set /dev/sdd2 faulty in /dev/md2
mdadm --manage /dev/md2 --remove /dev/sdc2
mdadm: hot removed /dev/sdc2 from /dev/md2
mdadm --manage /dev/md2 --remove /dev/sdd2
mdadm: hot removed /dev/sdd2 from /dev/md2
mdadm --grow -n 2 /dev/md2
raid_disks for /dev/md2 set to 3
mdadm --detail /dev/md2
/dev/md2:
Version : 1.2
Creation Time : Tue Dec 7 07:24:59 2021
Raid Level : raid1
Array Size : 3
Used Dev Size : 1952332800 (1861.89 GiB 1999.19 GB)
Raid Devices : 2
Total Devices : 2
Persistence : Superblock is persistent
Intent Bitmap : Internal
Update Time : Sun Nov 13 05:07:35 2022
State : clean
Active Devices : 2
Working Devices : 2
Failed Devices : 0
Spare Devices : 0
Consistency Policy : bitmap
Name : md2
UUID : d49251e3:7091f035:ef641ea4:bff15c7f
Events : 79300
Number Major Minor RaidDevice State
2 8 2 0 active sync /dev/sda2
3 8 18 1 active sync /dev/sdb2
## Creating the new array
Next, I zeroed out the drives and created a new array called md3.
mdadm --zero-superblock /dev/sdc2
mdadm --zero-superblock /dev/sdd2
mdadm --create --verbose /dev/md3 --level=1 --raid-devices=2 /dev/sdc2 /dev/sdd2
mdadm: Note: this array has metadata at the start and
may not be suitable as a boot device. If you plan to
store '/boot' on this device please ensure that
your boot-loader understands md/v1.x metadata, or use
--metadata=0.90
mdadm: size set to 1952331776K
mdadm: automatically enabling write-intent bitmap on large array
Continue creating array? y
mdadm: Defaulting to version 1.2 metadata
mdadm: array /dev/md3 started.
$ vi /etc/mdadm.conf
ARRAY /dev/md/md2 metadata=1.2 UUID=d49251e3:7091f035:ef641ea4:bff15c7f name=md2
ARRAY /dev/md/md3 metadata=1.2 UUID=10f87b98:e31749b4:ee14c8f0:5fae7870 name=md3
$ update-initramfs -u
update-initramfs: Generating /boot/initrd.img-5.15.0-52-generic
I: The initramfs will attempt to resume from /dev/sdd3
I: (UUID=e7159a7b-f2b7-4253-bfcd-80d78bb7df9c)
I: Set the RESUME variable to override this.
Then waited for it to rebuild the RAID array which took all night to complete.
mdadm --detail /dev/md3
Consistency Policy : bitmap
Resync Status : 0% complete
Name : md3 (local to host srv6.technowizardry.net)
UUID : 10f87b98:e31749b4:ee14c8f0:5fae7870
Events : 11
Sometime through this rebuild, the primary disk got mounted as read-only and couldn't be remounted as read-write which caused problems like, but a reboot fixed this
which service
bash: /usr/bin/which: Input/output error
|
I let it sync overnight and finally it was fully completed. Next we need to create an ext4
mkfs.ext4 /dev/md3
Folder Planning
I then identified which folders I wanted to move over to the new array. I started with just the bare minimum to see what effect it would have on performance:
- /etc/kubernetes
- /var/lib/etcd
Creating the new mount
Next, I identified the UUID of the new RAID array so I can enable auto mounting.
1
2
3
| blkid
...
/dev/md3: UUID="af2d8991-0995-4aef-b5c8-78ca736eb664" BLOCK_SIZE="4096" TYPE="ext4"
|
Next, stop the running containers, move the folders over
1
2
3
4
5
6
7
8
9
| cd /mnt/second
mkdir -p ./etc/kubernetes
mkdir -p ./var/lib/etcd
mv /etc/kubernetes /mnt/second/etc/
mv /var/lib/etcd /mnt/second/var/lib/etcd
mount -o bind /mnt/second/etc/kubernetes/ /etc/kubernetes/
mount -o bind /mnt/second/var/lib/etcd /var/lib/etcd
|
I changed the /etc/fstab file to ensure that Linux redirects the folders to the new array correctly:
1
2
3
4
5
| $ vi /etc/fstab
UUID=af2d8991-0995-4aef-b5c8-78ca736eb664 /mnt/second ext4 defaults 0 2
/mnt/second/var/lib/etcd /var/lib/etcd none bind
/mnt/second/etc/kubernetes /etc/kubernetes none bind
|
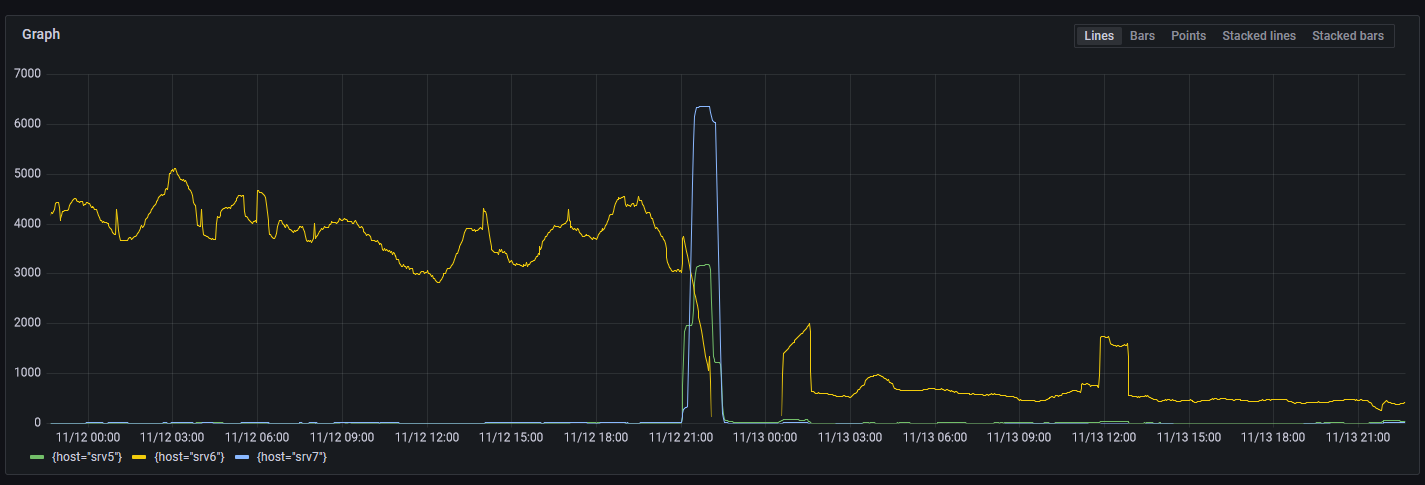
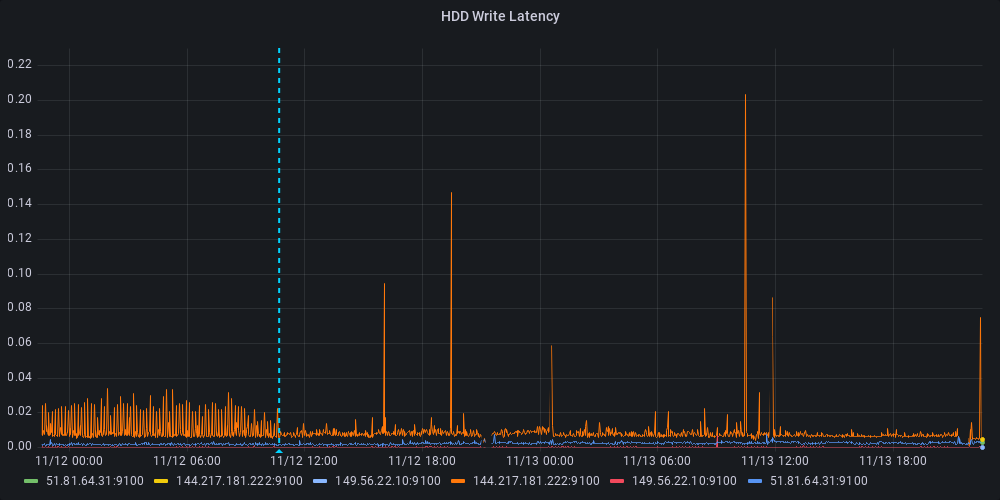
Finally, restart all containers and watch as the Kubernetes node comes back online. After some time, Kubernetes stabilized and I saw a large reduction in the number of slow writes that etcd complained about. Unfortunately it didn’t hit zero, but sadly HDDs are slow compared to SSDs.
Loki search results for “apply request took too long”
Conclusion
In this post, I walked through identifying a Kubernetes control plane issue to figuring out it’s likely caused by disk write latency on one of the machines. This lead me to redesign the RAID array configuration. It improved things, but not as much as I hoped.