In previous posts in this series, I walked through how to get data flowing into Home Assistant.
In this post, we’ll get it flowing into InfluxDB for long-term retention.

InfluxDB
If you haven’t already installed InfluxDB, follow the official guide here. Then install the HA InfluxDB integration. The default InfluxDB integration sends a large amount of information that’s not useful. Here’s an example configuration that reduces it:
 1
 2
 3
 4
 5
 6
 7
 8
 9
10
11
12
13
14
15
16
17
18
19
20
21
22
23
| influxdb:
host: influxdb-influxdb2.datastore.svc.cluster.local.
port: 8086
ssl: false
api_version: 2
token: {token}
bucket: homeassistant
organization: influxdata
component_config_domain:
sensor:
ignore_attributes:
- attribution
- device_class
- state_class
- last_reset
- integration
- description
- unit_of_measurement
- friendly_name
- type
include:
domains:
- sensor
|
Queries
I’ve put together a few example queries that I use in my Grafana dashboards here.
Energy Usage using KwH
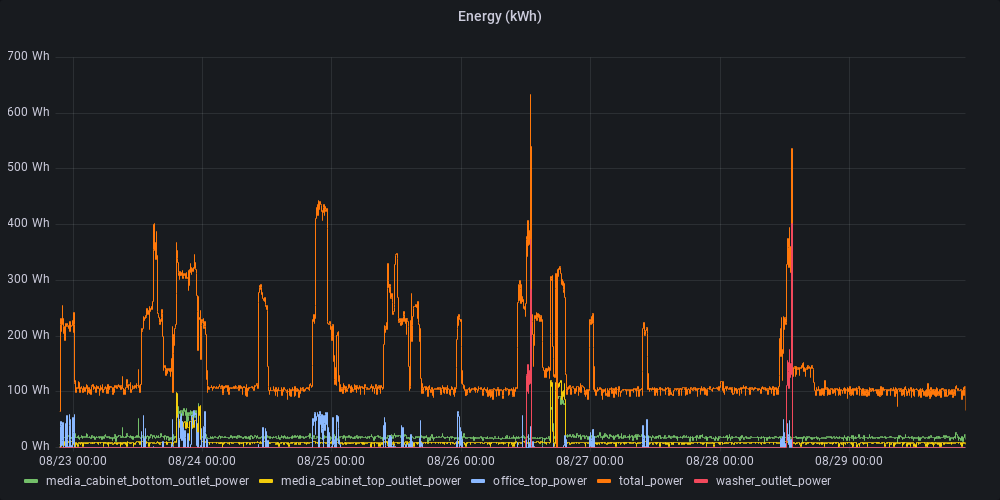
The following query returns energy usage over time. This query is more useful than simply averaging Watts over a time since it accounts for spikes and drops smaller than the window period.
Note: The InfluxDB seems to use the UTC time zone, whereas Home Assistant will use your local time zone on the energy dashboard. This can result in the numbers not matching, but using timeShift will fix them. Update timeZoneOffset to match your time zone.
 1
 2
 3
 4
 5
 6
 7
 8
 9
10
11
12
| import "timezone"
option location = timezone.location(name: "America/Los_Angeles")
from(bucket: "homeassistant")
|> range(start: v.timeRangeStart, stop: v.timeRangeStop)
|> filter(fn: (r) => r["_measurement"] == "kWh")
|> filter(fn: (r) => r["_field"] == "value")
|> filter(fn: (r) => r["domain"] == "sensor")
|> difference(nonNegative: true)
|> aggregateWindow(every: v.windowPeriod, fn: sum)
|> yield(name: "energy")
|
Energy Usage using watts
The prior query is more accurate if your sensors themselves report energy usage because the devices do continual aggregation, but the GreenEye Monitor does not itself collect kWh so we have to do the integral ourselves.
The following query returns energy usage over time. This query is more useful than simply averaging Watts over a time since it accounts for spikes and drops smaller than the window period.
 1
 2
 3
 4
 5
 6
 7
 8
 9
10
11
12
13
14
| from(bucket: "homeassistant")
|> range(start: v.timeRangeStart, stop: v.timeRangeStop)
|> filter(fn: (r) => r["_measurement"] == "W")
|> filter(fn: (r) => r["_field"] == "value")
|> filter(fn: (r) => r["domain"] == "sensor")
|> aggregateWindow(
every: v.windowPeriod,
fn: (tables=<-, column) =>
tables
|> integral(unit: v.windowPeriod)
|> map(fn: (r) => ({ r with _value: r._value / 1000.0}))
|> set(key: "_measurement", value: "kWh")
)
|> yield(name: "mean")
|
Energy Costs
This query calculates the cost of a given energy consumer over a time period and can be aggregated to any time period. If you zoom in far, you’ll find that things are measured in fractions of pennies.
 1
 2
 3
 4
 5
 6
 7
 8
 9
10
11
12
13
| costPerkWh = 0.1056
from(bucket: "homeassistant")
|> range(start: v.timeRangeStart, stop: v.timeRangeStop)
|> filter(fn: (r) => r["domain"] == "sensor")
|> filter(fn: (r) => r["_measurement"] == "W")
|> filter(fn: (r) => r["_field"] == "value")
|> aggregateWindow(every: v.windowPeriod, fn: mean, createEmpty: true)
|> fill(usePrevious: true)
|> map(fn: (r) => ({r with
_value: r._value * costPerkWh
}))
|> yield(name: "mean")
|
Data Retention
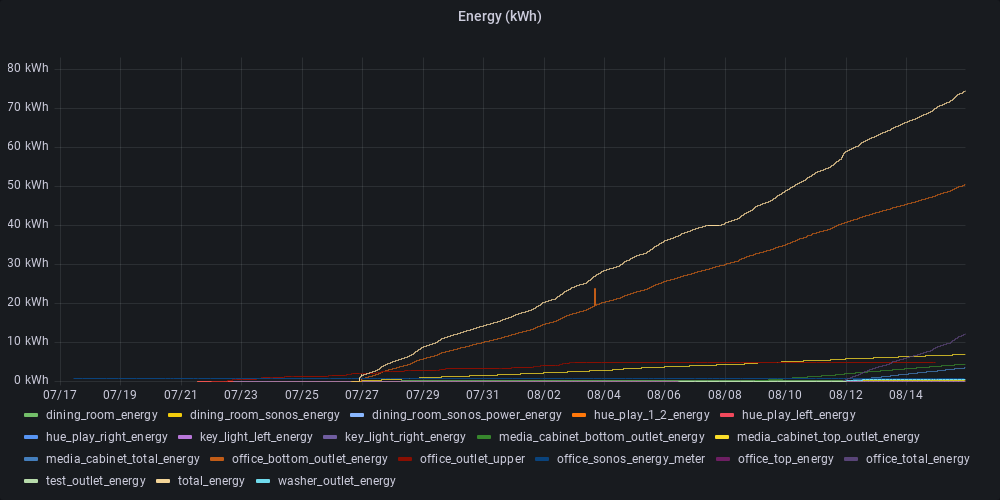
The kWh metric is important to know how much energy you’re actively using and being billed for, however Home Assistant tracks it as an ever increasing total number from 0 to infinity. This is problematic because you can’t aggregate a counter over different time periods to see how much you’re using month over month or week over week.

Instead, we need to convert this to a gauge-style metric where it contains the number of watt-hours used in a particular time period, not ever increasing.
I initially tried to aggregate to different levels including daily, however I encountered time zone issues (reference). InfluxDB runs all jobs in UTC, but I want to work in the local zone because that’s how my bill is calculated. Instead storing at hourly already provides a massive reduction in data sizes ~10k-15k data points per entity per day to only 24 per entity.
Data retention is controlled at the bucket level, so create a new bucket with a longer retention policy and name it something like energy-1hr (since it’ll store hourly aggregations.)
Seeing Double
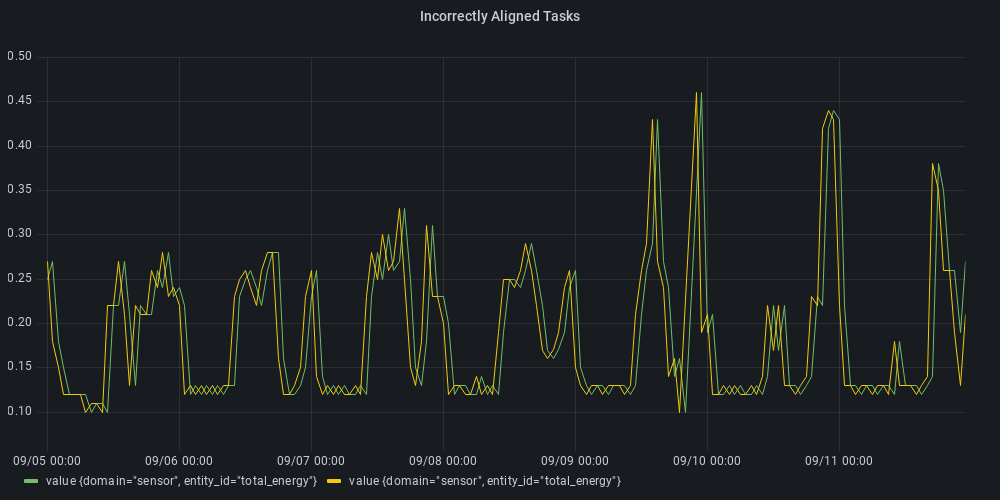
I created a downsample job based on the kWh query described ahead, but after running the job for a few days, I tried comparing it to the raw data stored in my original bucket and found that everything seemed to be shifted over by 1 hour.

But after shifting the query over, I still saw differences. I wrote a query to compare the results:
 1
 2
 3
 4
 5
 6
 7
 8
 9
10
11
12
13
14
15
16
17
18
19
20
21
22
23
24
25
26
27
28
29
30
31
32
33
34
35
36
| import "timezone"
import "date"
import "join"
import "math"
option location = timezone.location(name: "America/Los_Angeles")
DOWNSAMPLED = from(bucket: "energy-1h")
|> range(start: v.timeRangeStart, stop: v.timeRangeStop)
|> filter(fn: (r) => r["_measurement"] == "kWh")
|> filter(fn: (r) => r["_field"] == "value")
|> filter(fn: (r) => r["domain"] == "sensor")
|> filter(fn: (r) => r["entity_id"] == "total_energy")
|> aggregateWindow(every: 1h, fn: sum, createEmpty: false)
|> drop(columns: ["_start", "_stop"])
|> group(columns: ["entity_id"])
RAW = from(bucket: "homeassistant")
|> range(start: v.timeRangeStart, stop: v.timeRangeStop)
|> filter(fn: (r) => r["_measurement"] == "kWh")
|> filter(fn: (r) => r["_field"] == "value" and r["entity_id"] == "total_energy")
|> difference(nonNegative: true)
|> aggregateWindow(every: 1h, fn: sum, createEmpty: false)
|> drop(columns: ["_start", "_stop"])
|> group(columns: ["entity_id"])
COMPUTED = RAW
|> timeShift(duration: -1s)
|> aggregateWindow(every: 1h, fn: sum, createEmpty: false)
|> drop(columns: ["_start", "_stop"])
|> group(columns: ["entity_id"])
join.left(left: RAW, right: DOWNSAMPLED, on: (l, r) => l._time == r._time, as: (l, r) => ({ l with _value: r._value - l._value, _field: "error" }))
|> set(key: "_field", value: "error")
|> map(fn: (r) => ({r with _value: math.abs(x: r._value)}))
|> sum(column: "_value")
|
Which gave me a total error of 4.93 kWh / 7 days. This is weird. I started researching bugs on the internet and came across these:
https://github.com/influxdata/influxdb/issues/17100 - Task alignment issue
https://github.com/influxdata/influxdb/issues/17323 - Task Alignment issue
https://github.com/influxdata/flux/issues/1730 - aggregateWindow _start/_stop issue
After some investigation, I found out that aggregateWindow() rounds windows to the end of the window. This meant that data from 10am-11am was placed into a record with _time:11am, then the second aggregateWindow when I pulled it out of the downsampled bucket, windowed it to be 12pm. I couldn’t just drop the second aggregateWindow function because I wanted to be able to aggregate up into larger buckets if needed.
My solution for this is to timeShift the data by -1s:
 1
 2
 3
 4
 5
 6
 7
 8
 9
10
11
12
| BY_KWH =
from(bucket: "homeassistant")
|> range(start: -task.every)
|> filter(fn: (r) => r["domain"] == "sensor")
|> filter(fn: (r) => r["_measurement"] == "kWh")
|> filter(fn: (r) => r["_field"] == "value")
|> difference(nonNegative: true)
BY_KWH
|> aggregateWindow(every: 1h, fn: sum, createEmpty: false)
|> timeShift(duration: -1s)
|> to(bucket: "energy-1h")
|
This brought the error down to 0.25 kWh across the last 7 days.
Unexpected differences
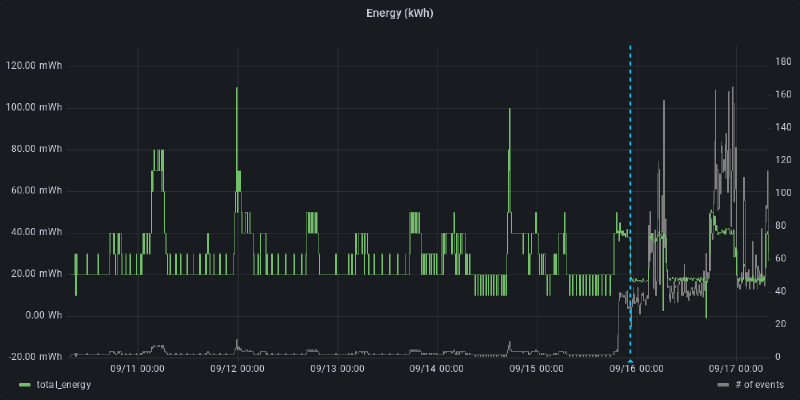
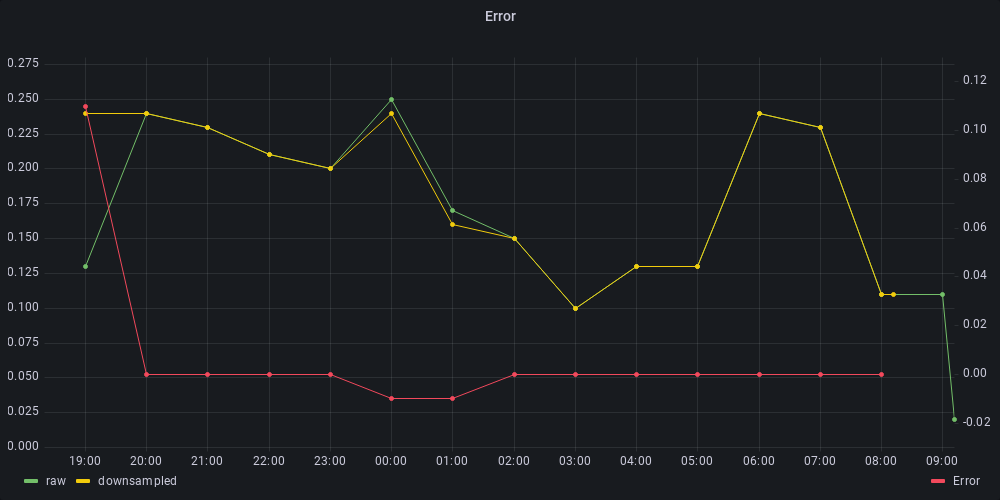
Even after temporarily adjusting the data and comparing, I still noticed errors. . My thought was that possible the first item was not being calculated correctly because the difference() was ignoring the first item or not correctly missing the first few minutes of energy usage. Switching to show the time in UTC seemed to confirm this issue:

I fixed this by aggregating the last 2 hours of data up to calculate the difference over the last midnight, then saving only the last 1 hour:
 1
 2
 3
 4
 5
 6
 7
 8
 9
10
11
12
13
| BY_KWH =
from(bucket: "homeassistant")
|> range(start: -2h)
|> filter(fn: (r) => r["domain"] == "sensor")
|> filter(fn: (r) => r["_measurement"] == "kWh")
|> filter(fn: (r) => r["_field"] == "value")
|> difference(nonNegative: true)
BY_KWH
|> aggregateWindow(every: 1h, fn: sum, createEmpty: false)
|> range(start: -1h)
|> timeShift(duration: -1s)
|> to(bucket: "energy-1h")
|
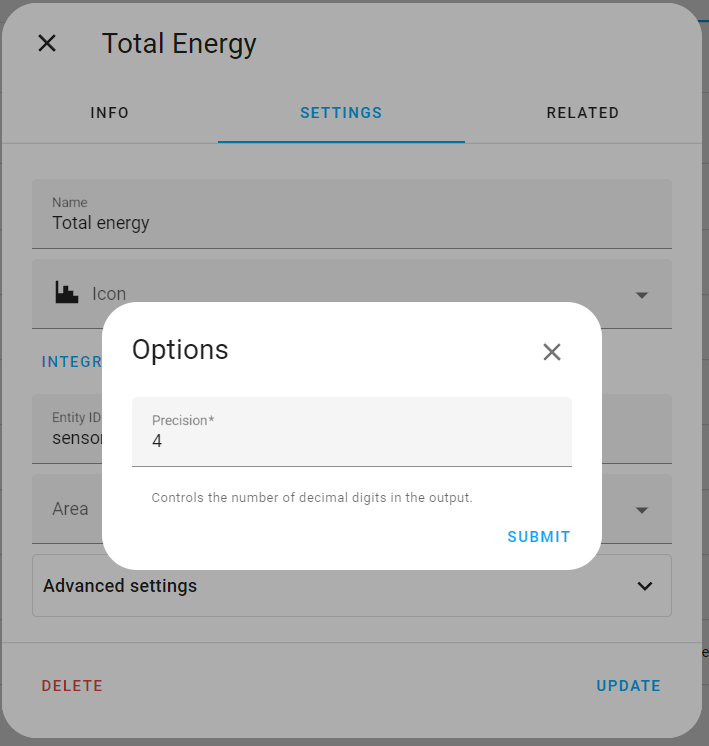
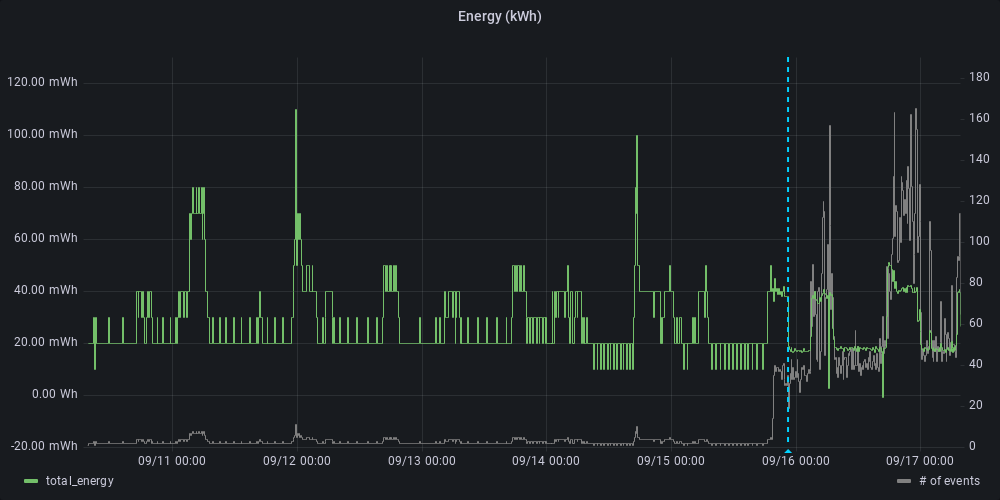
That helped, but looking at the raw kWh graph, there didn’t seem to be a lot of precision in the data. To fix this, I increased the precision of the Home Assistant Helper.
Four decimal precision points ensures that we can measure loads as low as 100mWh. Probably over kill, but I’ve got some devices that idle there.

This increased the number of events flowing into InfluxDB and the Home Assistant Recorder, but the aggressive downsampling will compensate:

Create a InfluxDB Job
That leads to the final query that I scheduled in the Influx UI under Tasks > Create Task:
 1
 2
 3
 4
 5
 6
 7
 8
 9
10
11
12
13
14
15
16
17
18
19
20
21
22
23
24
25
26
27
28
29
30
31
32
33
34
35
36
37
38
39
40
41
42
43
44
45
46
47
48
49
50
51
52
53
54
| import "timezone"
import "strings"
import "date"
option location = timezone.location(name: "America/Los_Angeles")
option task = {name: "Energy Downsample (Hourly)", every: 1h, offset: 2m}
start = date.add(d: -3h, to: now())
actual = -2h
BY_KWH =
from(bucket: "homeassistant")
|> range(start: start)
|> filter(fn: (r) => r["domain"] == "sensor")
|> filter(fn: (r) => r["_measurement"] == "kWh")
|> filter(fn: (r) => r["_field"] == "value")
|> difference(nonNegative: true, keepFirst: true)
BY_KWH
|> aggregateWindow(every: 1h, fn: sum, createEmpty: false)
|> range(start: actual)
|> drop(columns: ["_start", "_stop"])
|> to(bucket: "energy-1h")
// Roll-up Brultech Energy Data
BY_WATTSEC =
from(bucket: "homeassistant")
|> range(start: start)
|> filter(fn: (r) => r["domain"] == "sensor")
|> filter(fn: (r) => r["_field"] == "watt_seconds")
|> difference(nonNegative: true)
BY_WATTSEC
|> aggregateWindow(every: 1h, fn: sum, createEmpty: false)
|> range(start: actual)
|> map(fn: (r) => ({r with _value: r._value / 1000.0 / 60.0 / 60.0}))
|> set(key: "_field", value: "value")
|> set(key: "_measurement", value: "kWh")
|> to(bucket: "energy-1h")
COST =
from(bucket: "homeassistant")
|> range(start: start)
|> filter(fn: (r) => r["_measurement"] == "USD")
|> filter(fn: (r) => r["_field"] == "value")
|> filter(fn: (r) => r["domain"] == "sensor")
|> filter(fn: (r) => strings.hasSuffix(v: r["entity_id"], suffix: "_energy_cost"))
|> difference(nonNegative: true)
COST
|> aggregateWindow(every: 1h, fn: sum, createEmpty: false)
|> range(start: actual)
|> drop(columns: ["_start", "_stop"])
|> to(bucket: "energy-1h")
|
Donate
If you've found these posts helpful and would like to support this work directly, your contribution would be appreciated and enable me to dedicate more time to creating future posts. Thank you for joining me!

