In the previous post in this series, I selected an energy monitoring system that is purely local based (no cloud), integrates into the breaker box, and showed how to connect it to the network and configure the size of each circuit. In this post, I’ll show how to connect the BrulTech GreenEye Energy Monitor to HomeAssistant and create some useful monitoring dashboards.
GreenEye Monitor Firmware
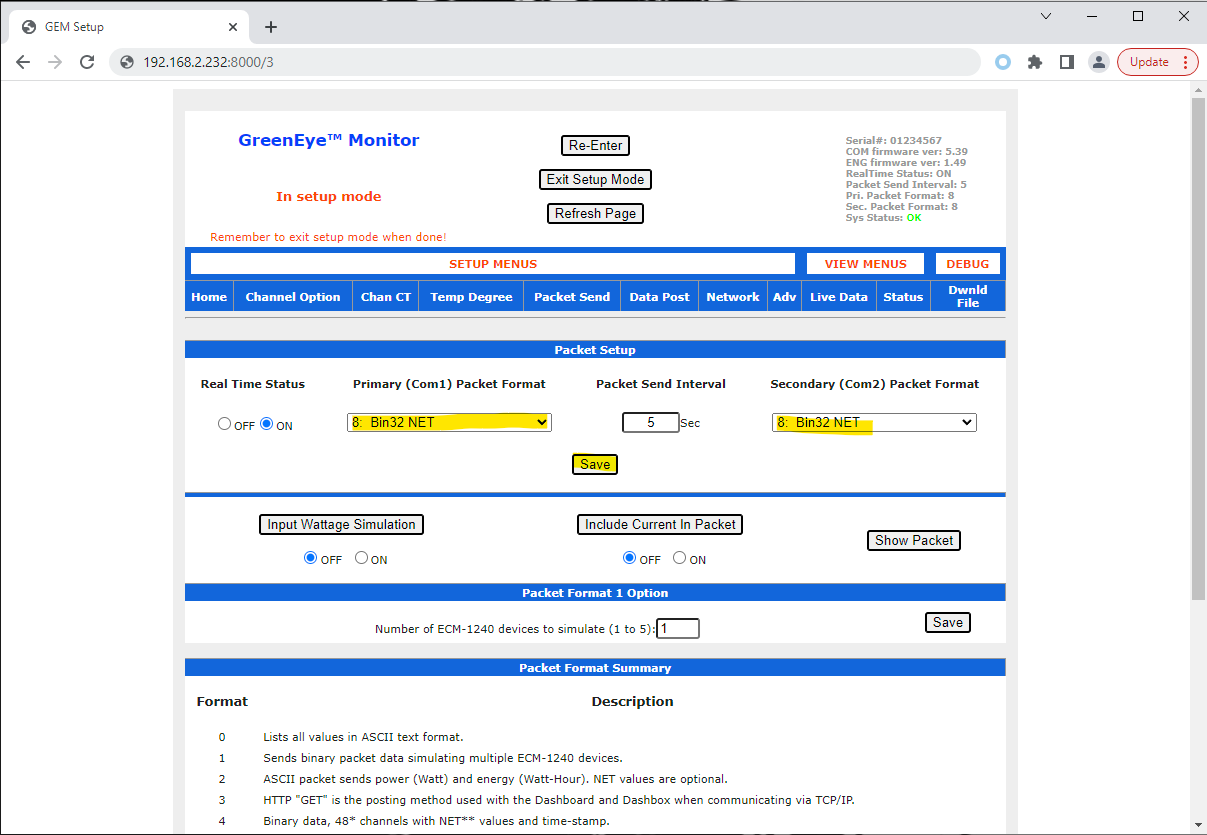
While trying to connect my monitor to Home Assistant, I came across a firmware bug in the GreenEye Monitor and found a forum thread that Brultech had a bug with their packet formats which has been fixed in firmware version 5.39+. To check and find the serial number which will be needed, navigate to http://{monitor ip}:8000/, then click “Enter Setup Mode”.
Make note of the serial number and firmware version in the top right corner.
If you’re not on 5.39 or above, download the latest version here and the network utility here. Connect to the monitor, then update the firmware.
On the top, blue menu panel click “Packet Send”, then change both COM1 and COM2 Packet Formats to Bin32 NET, then click save.
Home Assistant Setup
The integration for the GreenEye Monitor in HA is a bit out of date and can’t be easily added via the UI like some other integrations, however several developers are working on improving the state and moving to HACS. I’ll be following along and contributing now that I’ve got a working setup. Until that’s available, let’s install with the existing integration.
Open up the Home Assistant configuration.yml file, and add the following. Provide a short and meaningful name or even just use what’s labeled on the circuit breaker. I used the common prefix “main_panel_”, so I can create templates that reference all power sources on this breaker.
| |
Save the file, then restart Home Assistant for the changes to take affect.
Kubernetes Networking
The GreenEye needs to open a TCP connection to Home Assistant, however this is complicated in my setup because I’m using Kubernetes and all traffic to HA goes through my ingress controller, ingress-nginx. If you’re not doing this, skip ahead to the next step.
The issue is that NGINX is only proxying HTTP/HTTPS traffic.
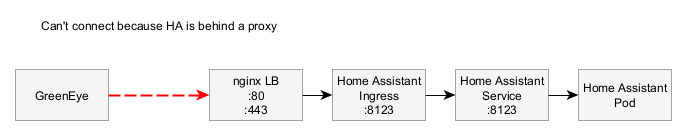
While it’s possible to use NGINX to proxy TCP ports, I wanted to preserve the source port which can’t be done with this TCP protocol. The easiest thing is to create a separate Layer 4 Load Balancer to forward just the port we need:
| |
Once the load balancer is created, make note of the IP address in the status block. This will be needed in the next step.
Start sending power data
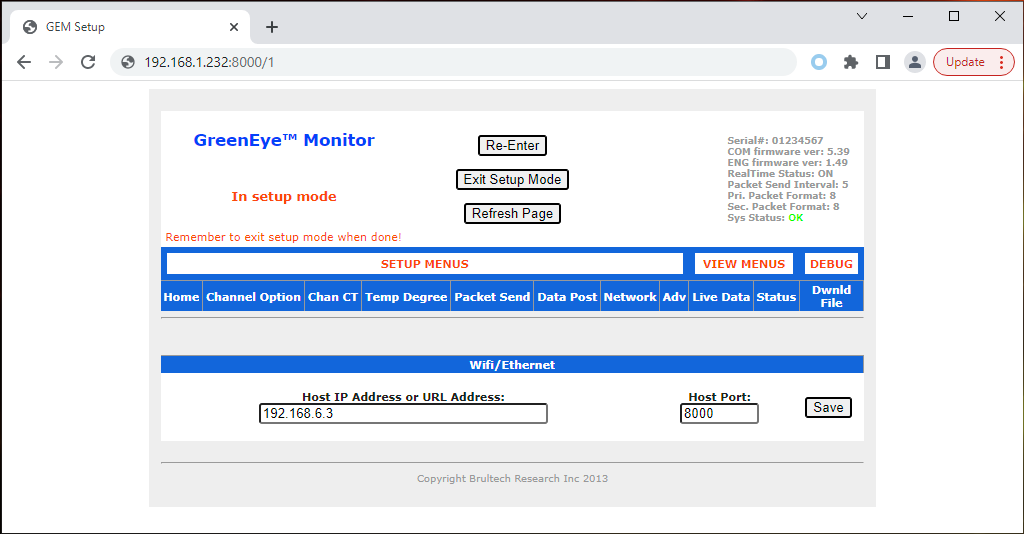
Then switch to the Network page. Enter the IP address of the load balancer created above or the IP address for Home Assistant in the box, then click save
After a few seconds, Home Assistant should start populating the dashboard with live power data.
Setting up the HA dashboard
Required Attributes
This integration does not correctly set the attributes so that Home Assistant treats this data as power and instead treats it as opaque sensor data. The only way to fix this is to create a *new* template sensor with the correct attributes. In my case, I didn’t have a CT covering total usage for my main panel, so I summed everything together:
| |
However, if you do have a total CT, then you can just override the attributes:
| |
Watts to kilowatt-hours
The energy monitor emits volts and watts, but this isn’t very useful because watts is instantaneous power usage, but electric companies and the HA energy dashboard both need to work with kWh (kilowatt-hours, 1kWh = 1,000 watts of power for 1 hour.) To convert from Watts to kWh, we need to integrate the value over time using a Riemann sum. This isn’t perfectly accurate, but since the input data is discretized over 5 second intervals, it’s close enough.
In Home Assistant, go to Settings > Integrations > Helpers.
Click Create helper > Integration - Riemann sum integral sensor
- Name your sensor something like “Main Panel Total Energy” (Energy because Energy is total power over time.
- Use the Left Riemann sum method (why?)
- Pick the kilo metric prefix
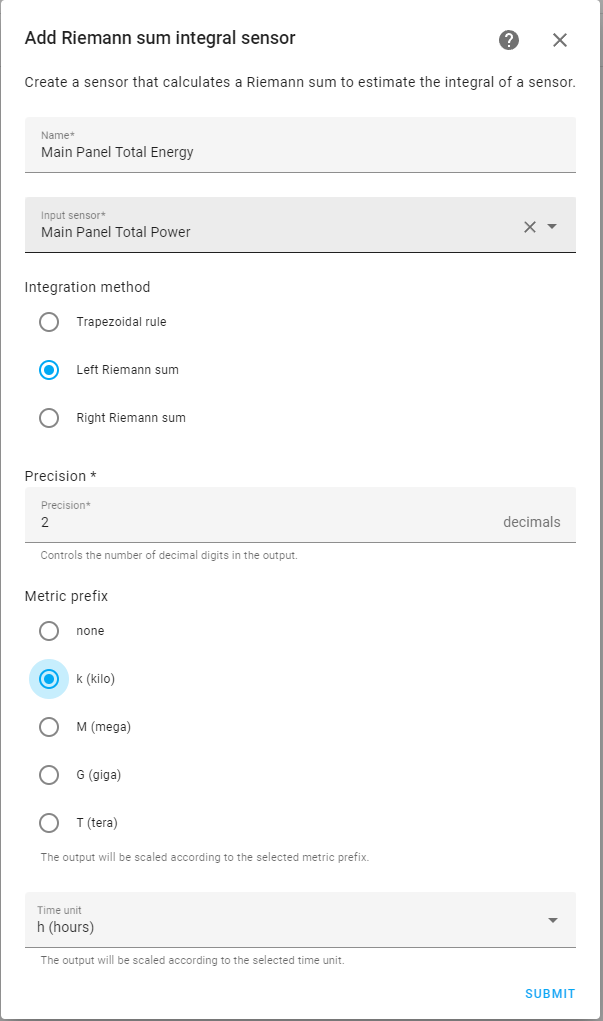
Then click submit. Give it a minute or two to update.
Knowing the current kWh rate
A lot of electricity providers have different rates through the year or even consumption based changes that increase the rate as you use more per day or month. My provider, Seattle City Light, publishes their rates here. They have summer rates and winter rates.
| USD/kWh | |
|---|---|
| Base service charge per day (Ignored for calculations) | $0.1974 |
| 1st block per kWh (Summer is >10kWh and Winter is >16kWh) | $0.1056 |
| 2nd block per kWh | $0.1307 |
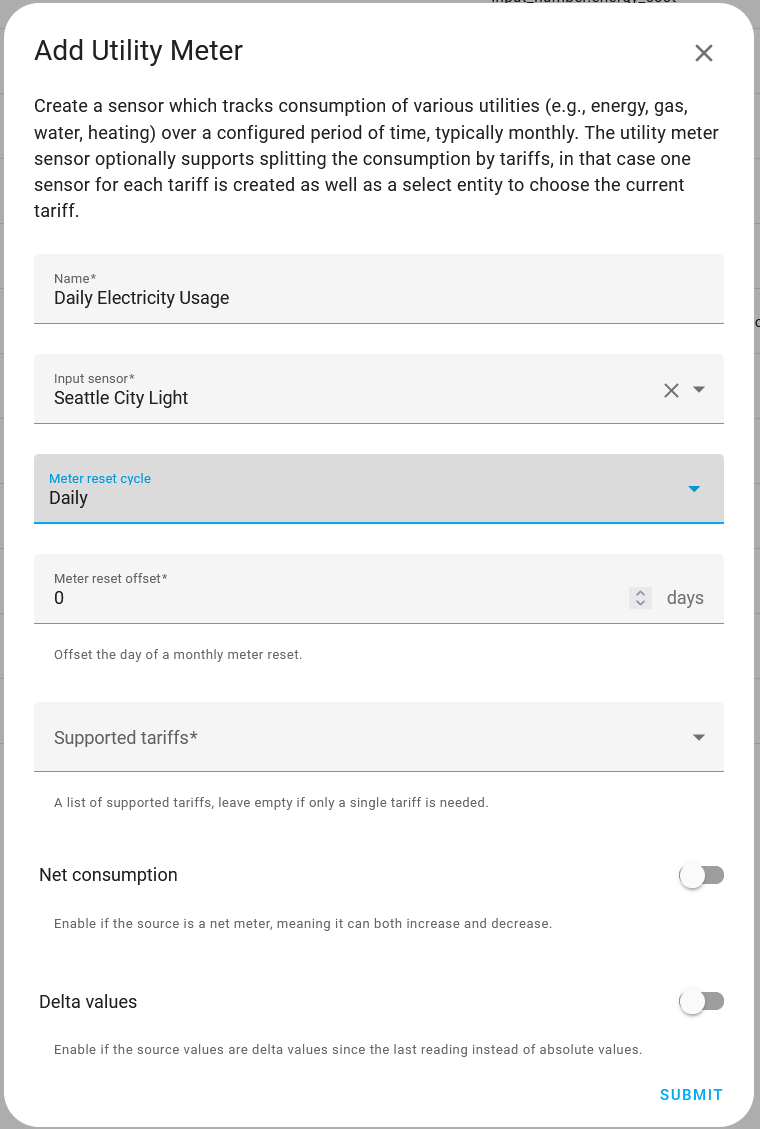
First, I need to create a helper that tracks my daily usage and resets every night. Create a helper in the Home Assistant UI in Settings > Devices & Services > Helpers.
Create a Utility Meter helper and enter a name and the input sensor. The name is used to create an entity name so it must match what you specify in the template in the next step.
Next, I defined a new template sensor. The following sensor is based on my rates, but you can adjust as you need.
| |
After that reload the templates in Developer Tools > YAML > YAML Reload Template Sensors.
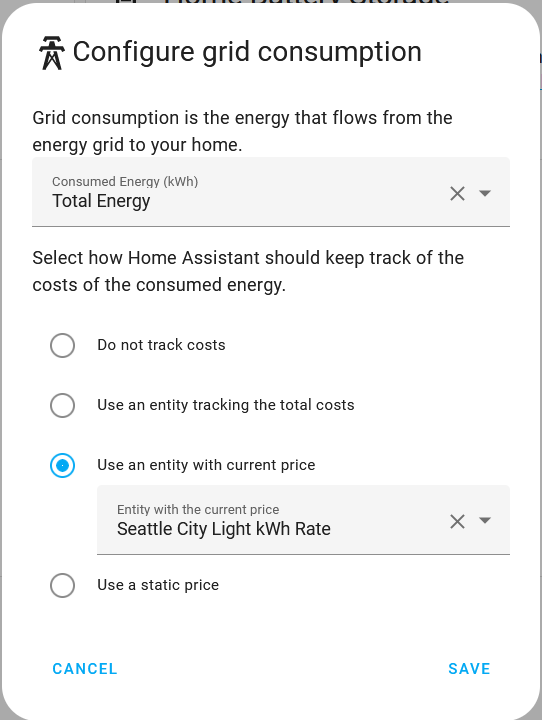
Setup the Energy Dashboard
Now you should be able to go to the Energy Dashboard and select the newly created Energy sensor for Grid consumption and rate sensor.
After a few hours you should start seeing metrics in this dashboard.
Reducing Recorder Usage
By default, the GreenEye Monitor sends updated data every 5 seconds. This ensures good accuracy, but produces too much data that isn’t useful for long-term statistics.
| |
Conclusion
In this post, I walked through how to connect the BrulTech to Home Assistant. In the next post, I’ll walk through how to manage data sizes with downsampling and data retention policies.
The Brultech is definitely not as polished as some of the other options, but it was very powerful and provided rich data without depending on the cloud.
Errata
- 2022-11-29 - The template to aggregate up the total power did not ignore irrelevant sensors, such as those named sensors.main_panel_total_energy, which caused the sum to infinitely increase.