Artwork by Sami Lee.
For the last 5+ years, I’ve been tracking my various aspects of my personal health using Samsung Health. It helps track weight, calories, heart rate, stress, and exercise and stores all of it in the app.
However, the app only gives some basic high level charts and insights. Luckily, it enables you to export your personal data into CSV files that you can then import into your tool of choice and perform any kind of analytics. In this post, I’m going to show how to export it all, then load it into Zeppelin and some sample Pandas queries that’ll enable you to start building more complex queries yourself.
Download your Data
First, open Samsung Health on your mobile phone
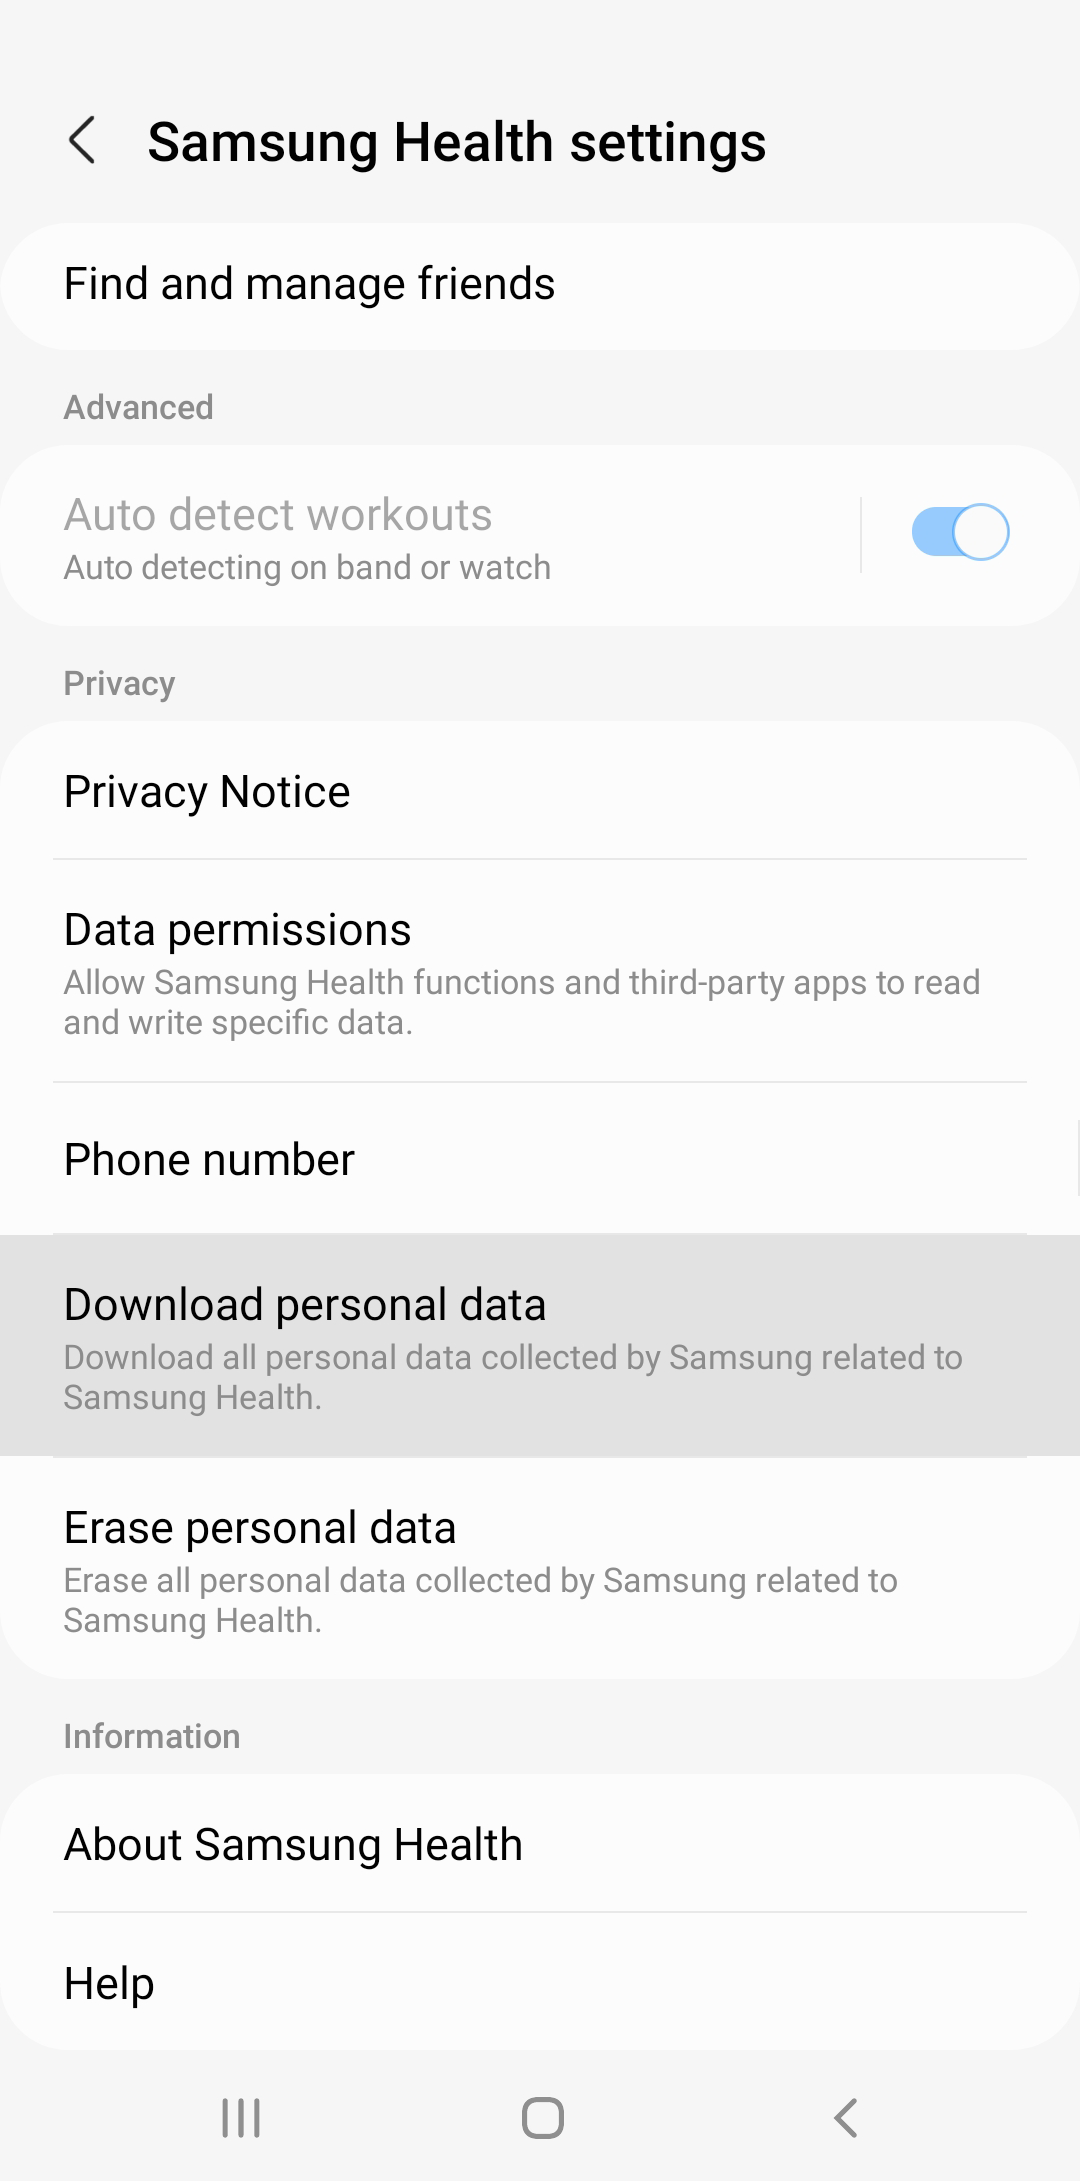
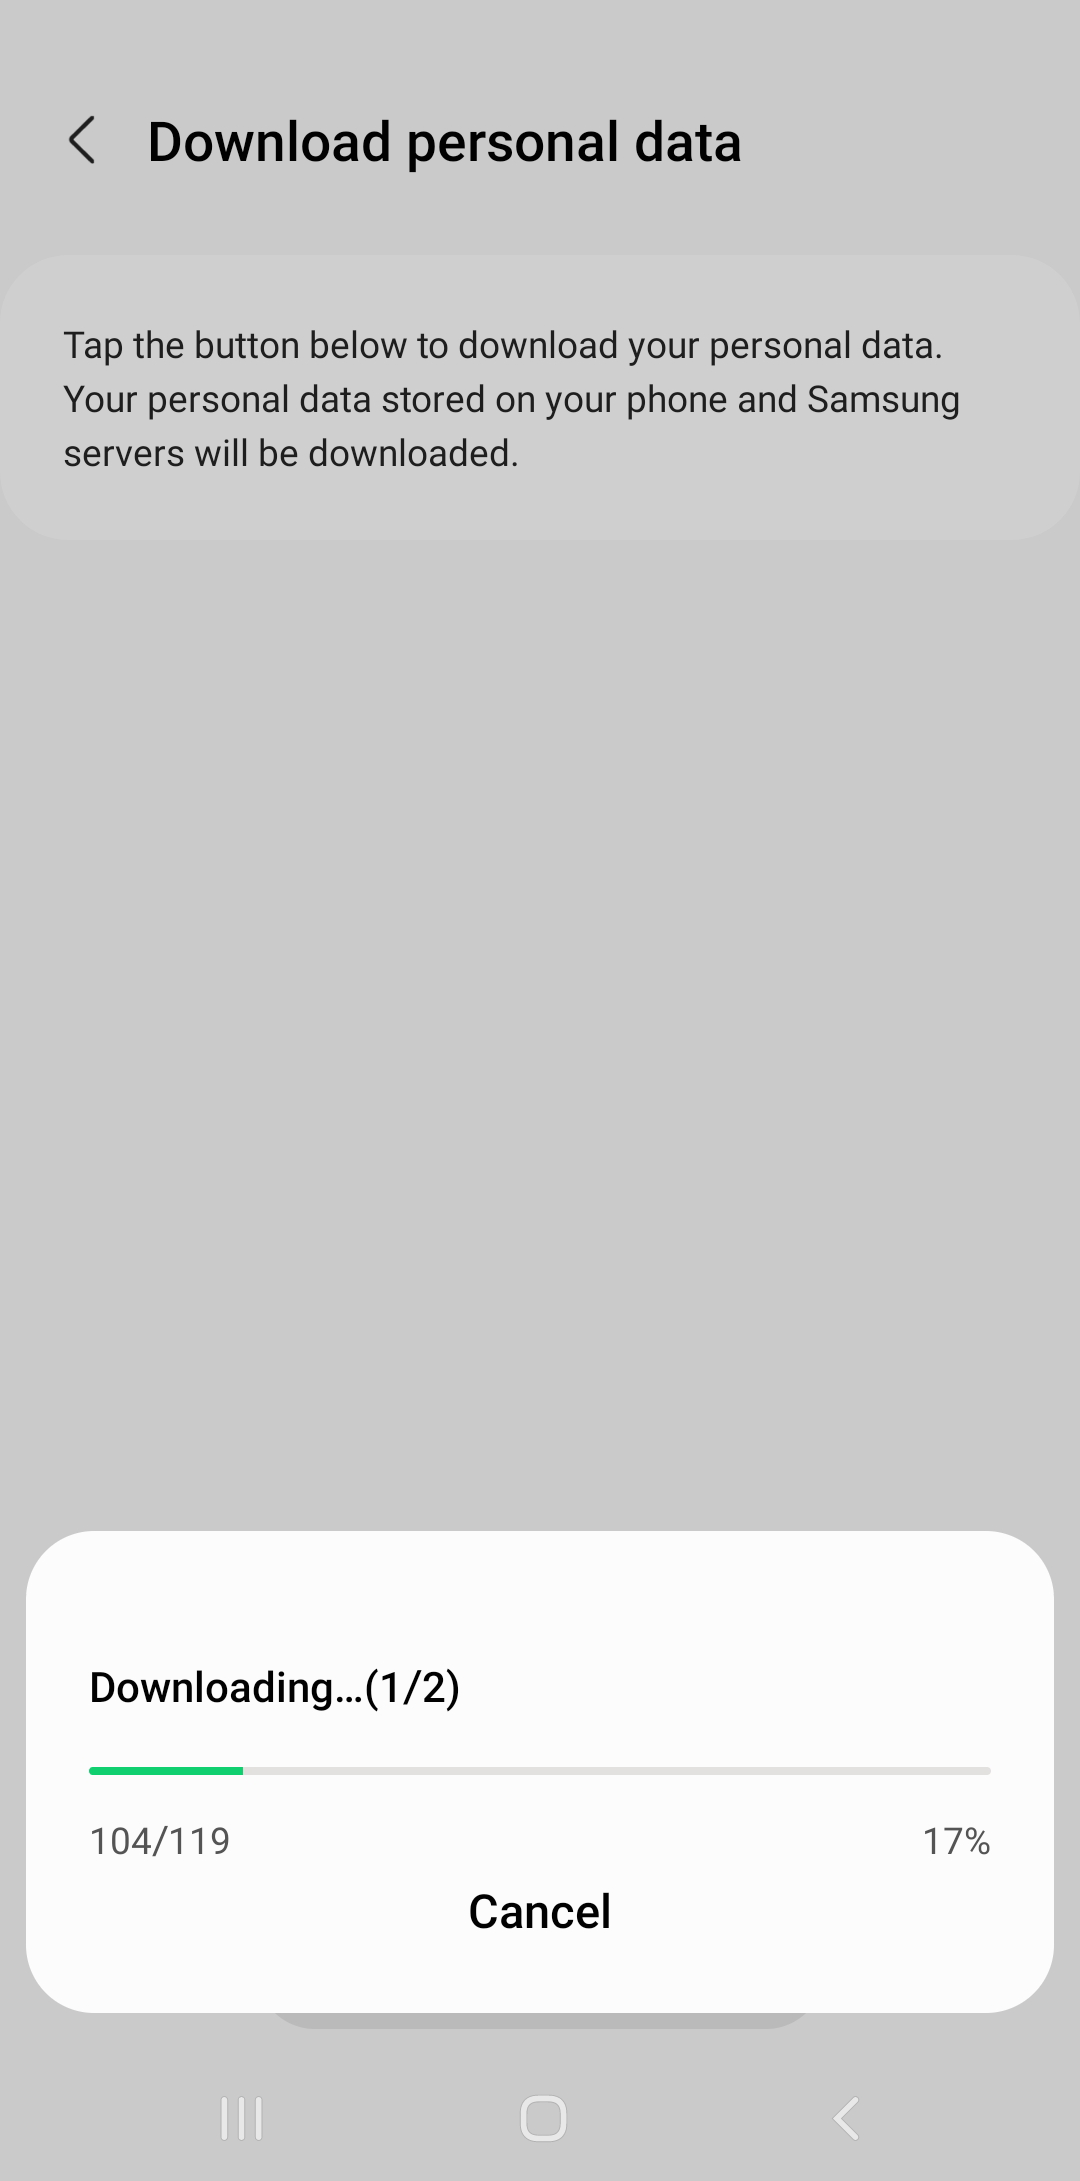
Scroll down and tap “Download personal data”
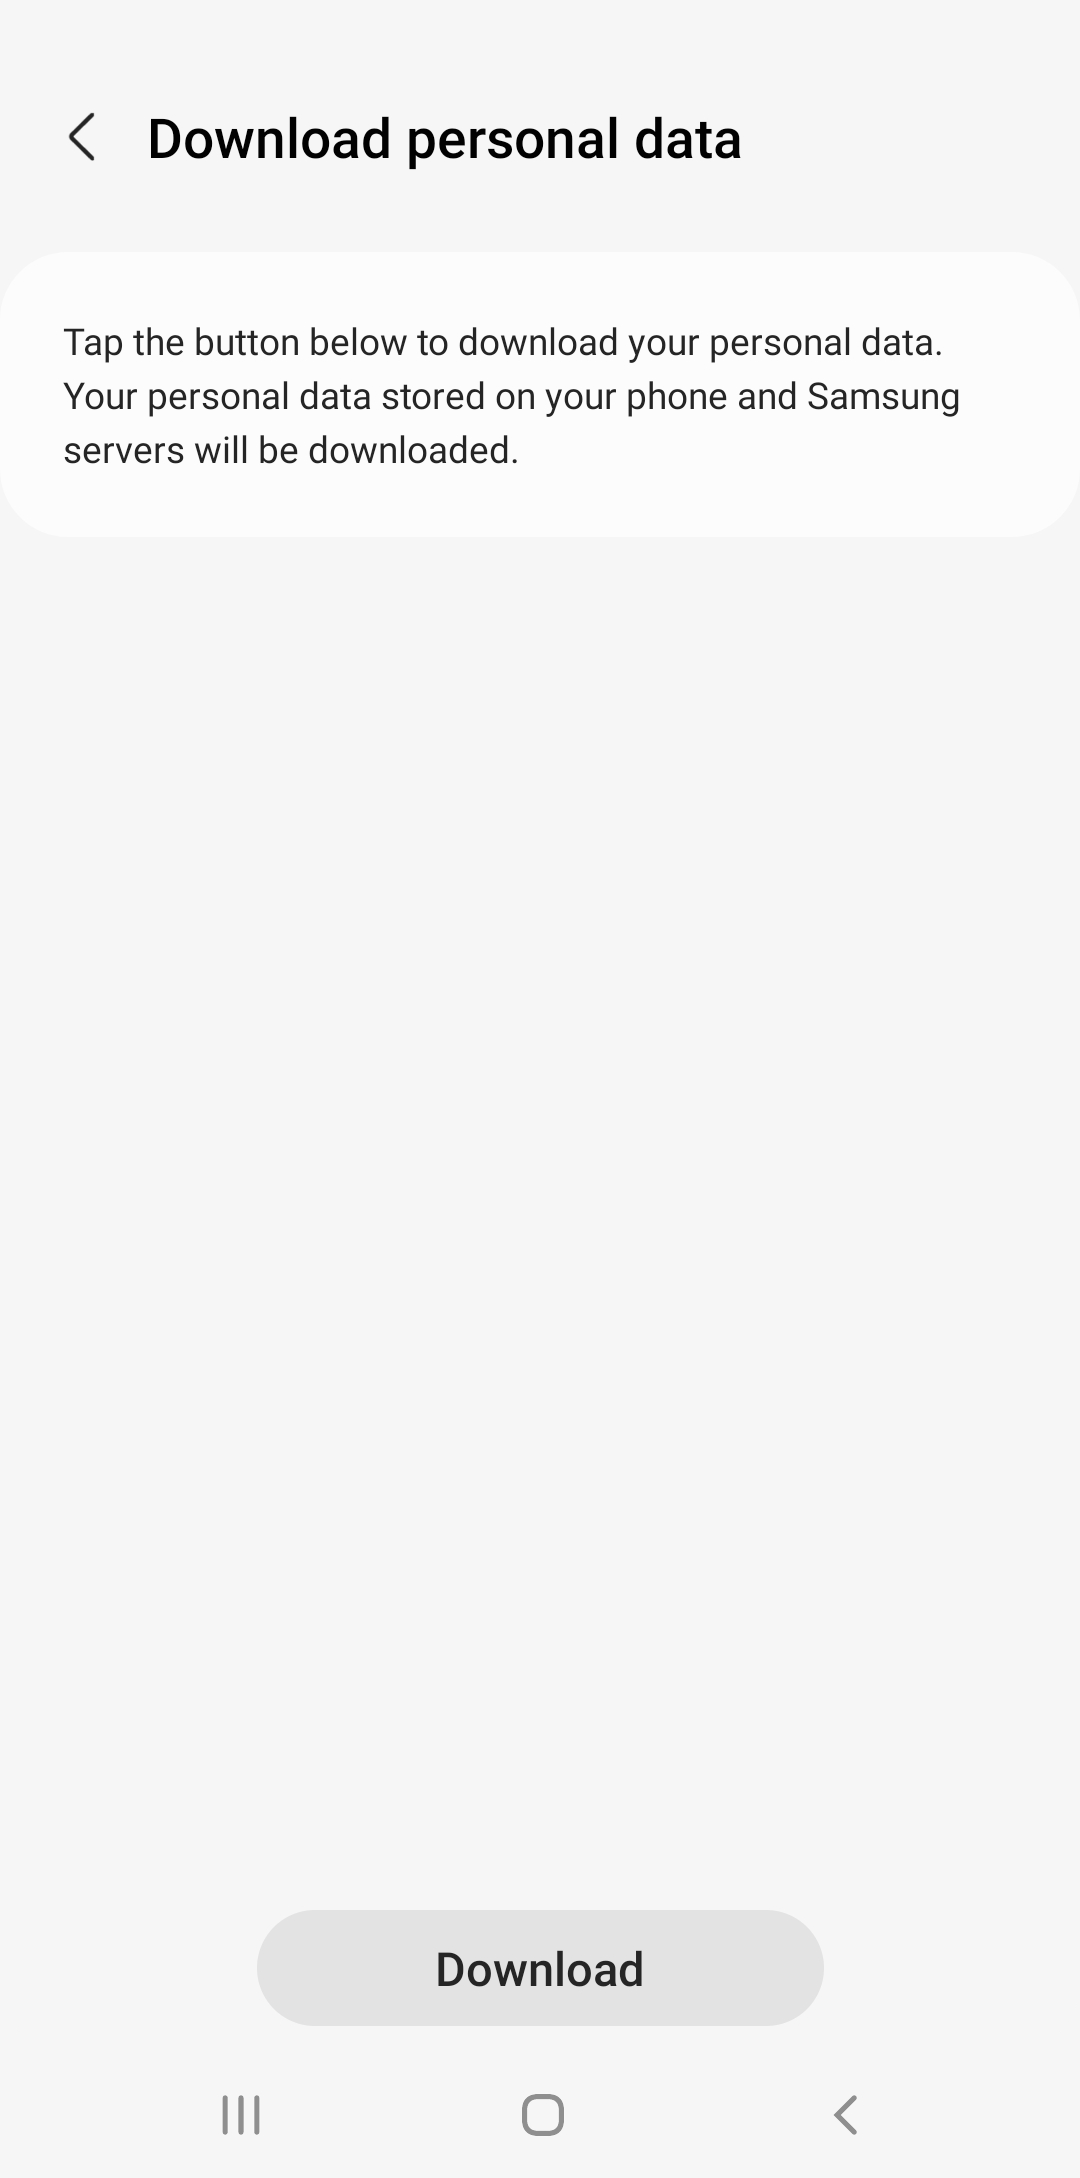
Tap the Download button
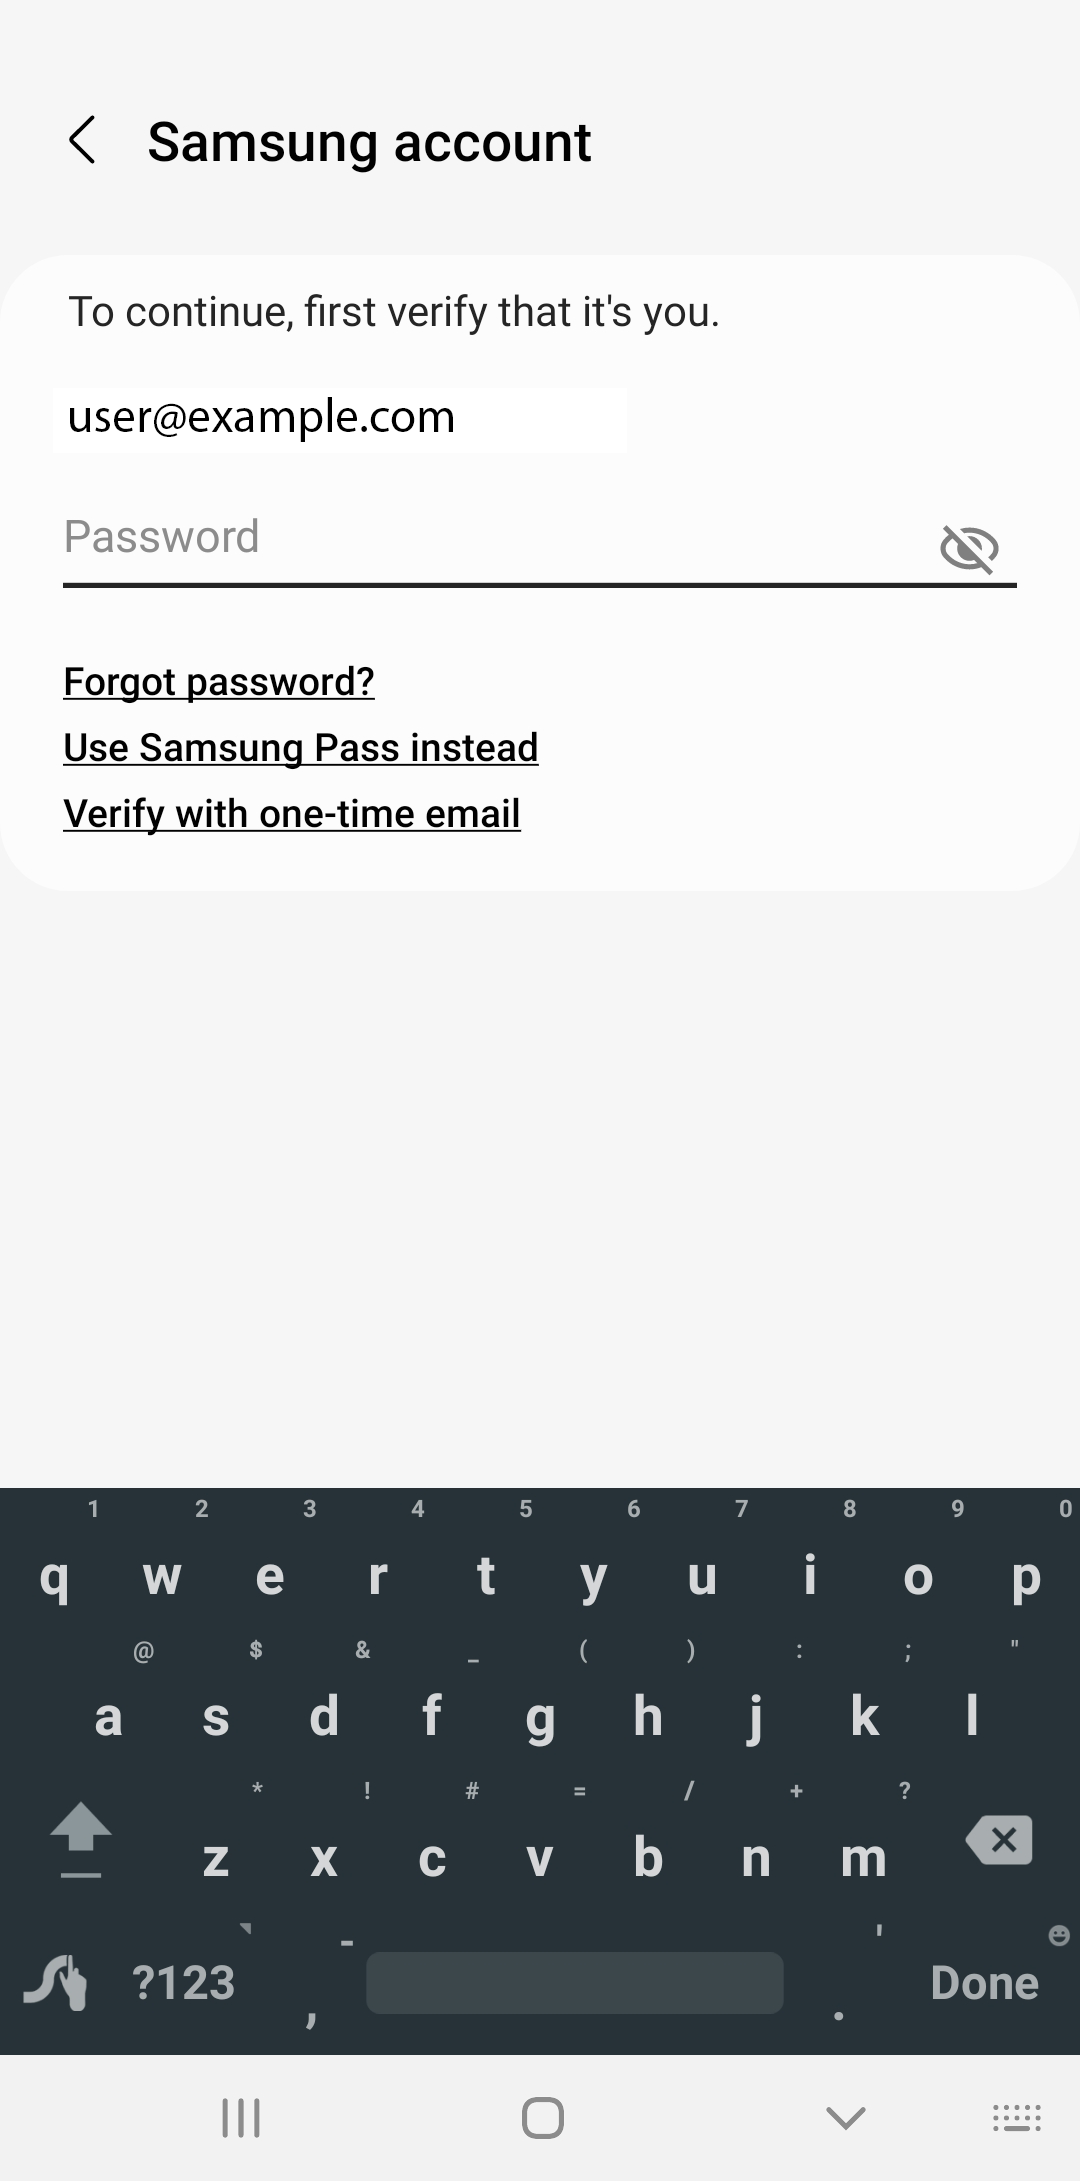
Login to your account when it prompts you
Wait for it to download
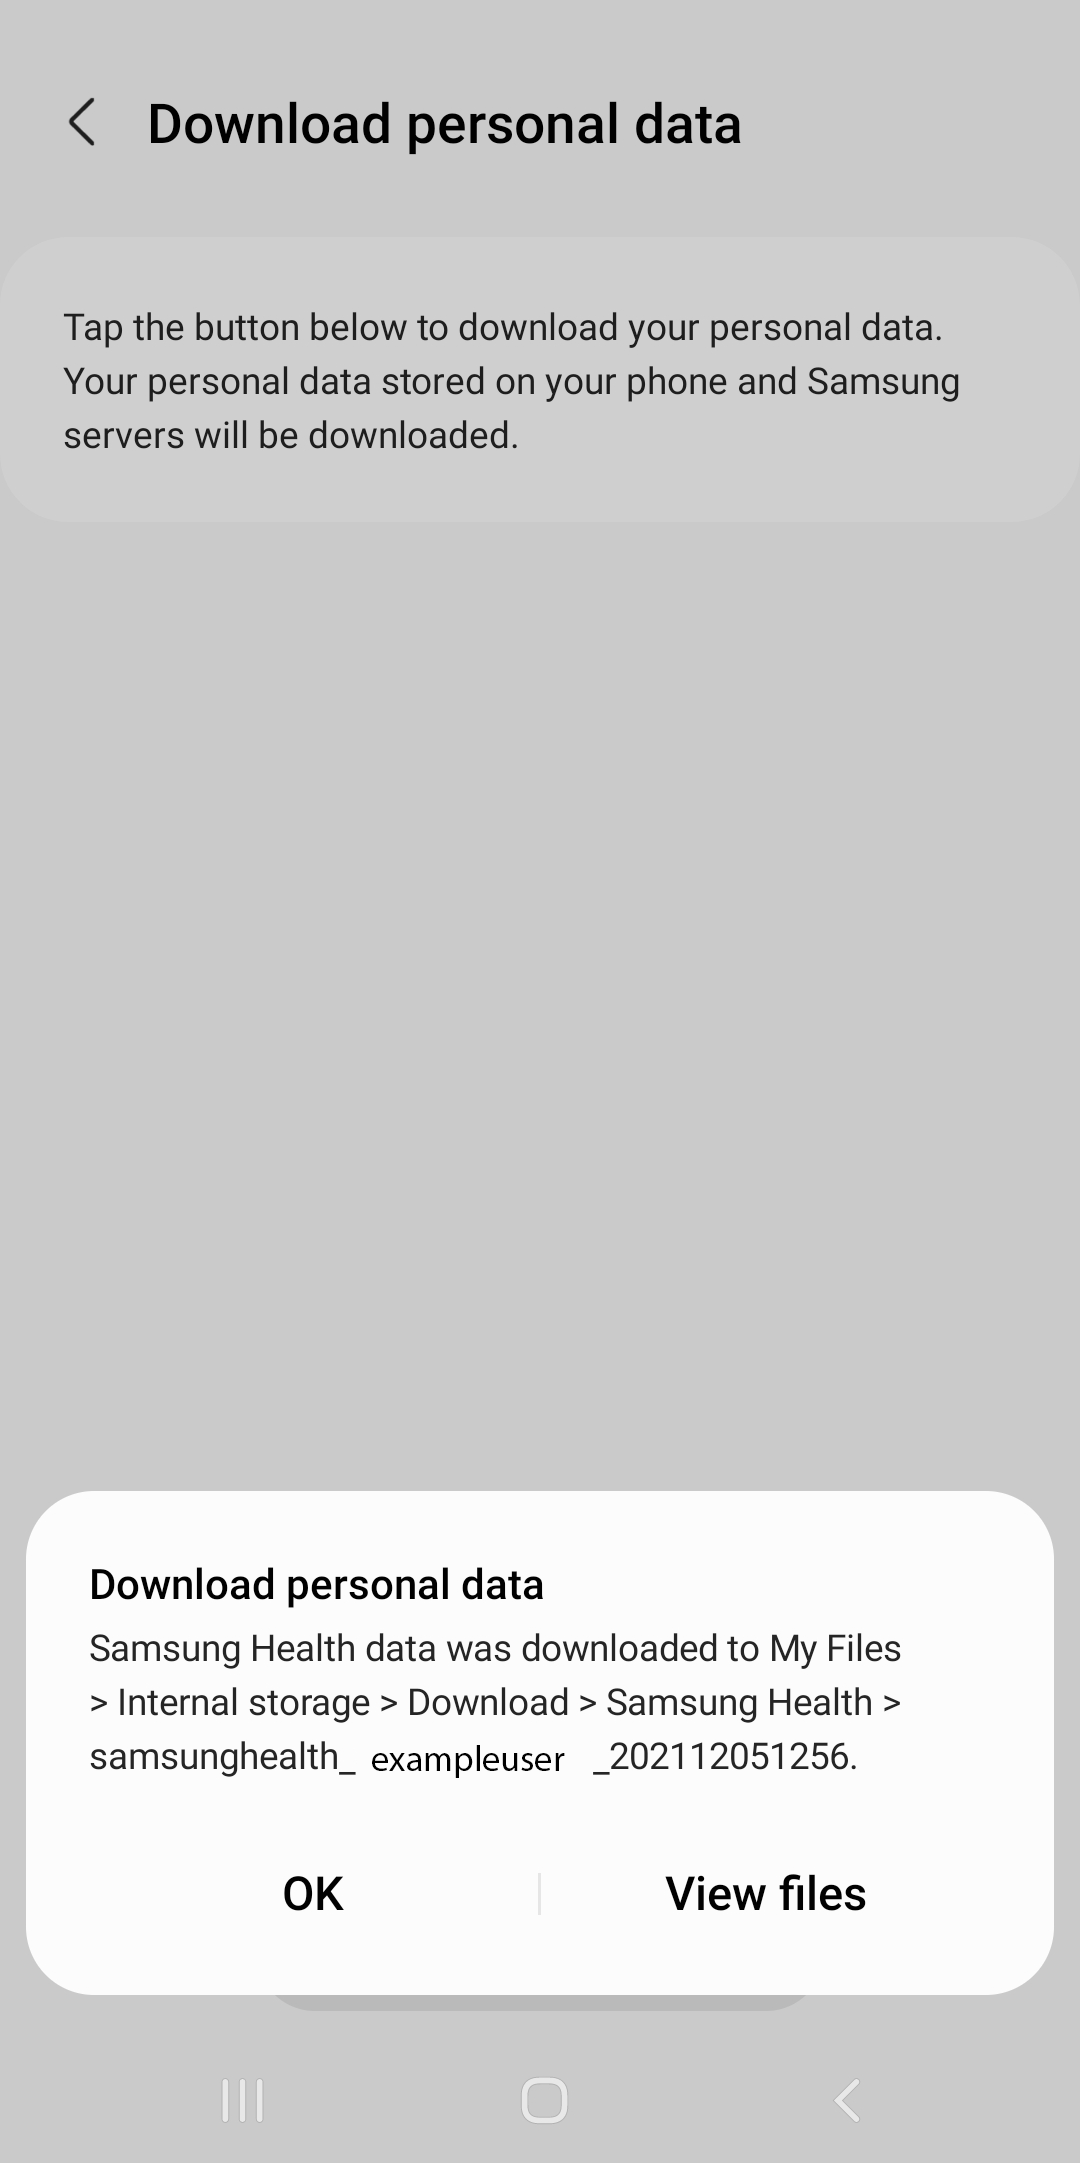
After it completes downloading, tap View files.
Select the file, tap compress, save it as a zip file.
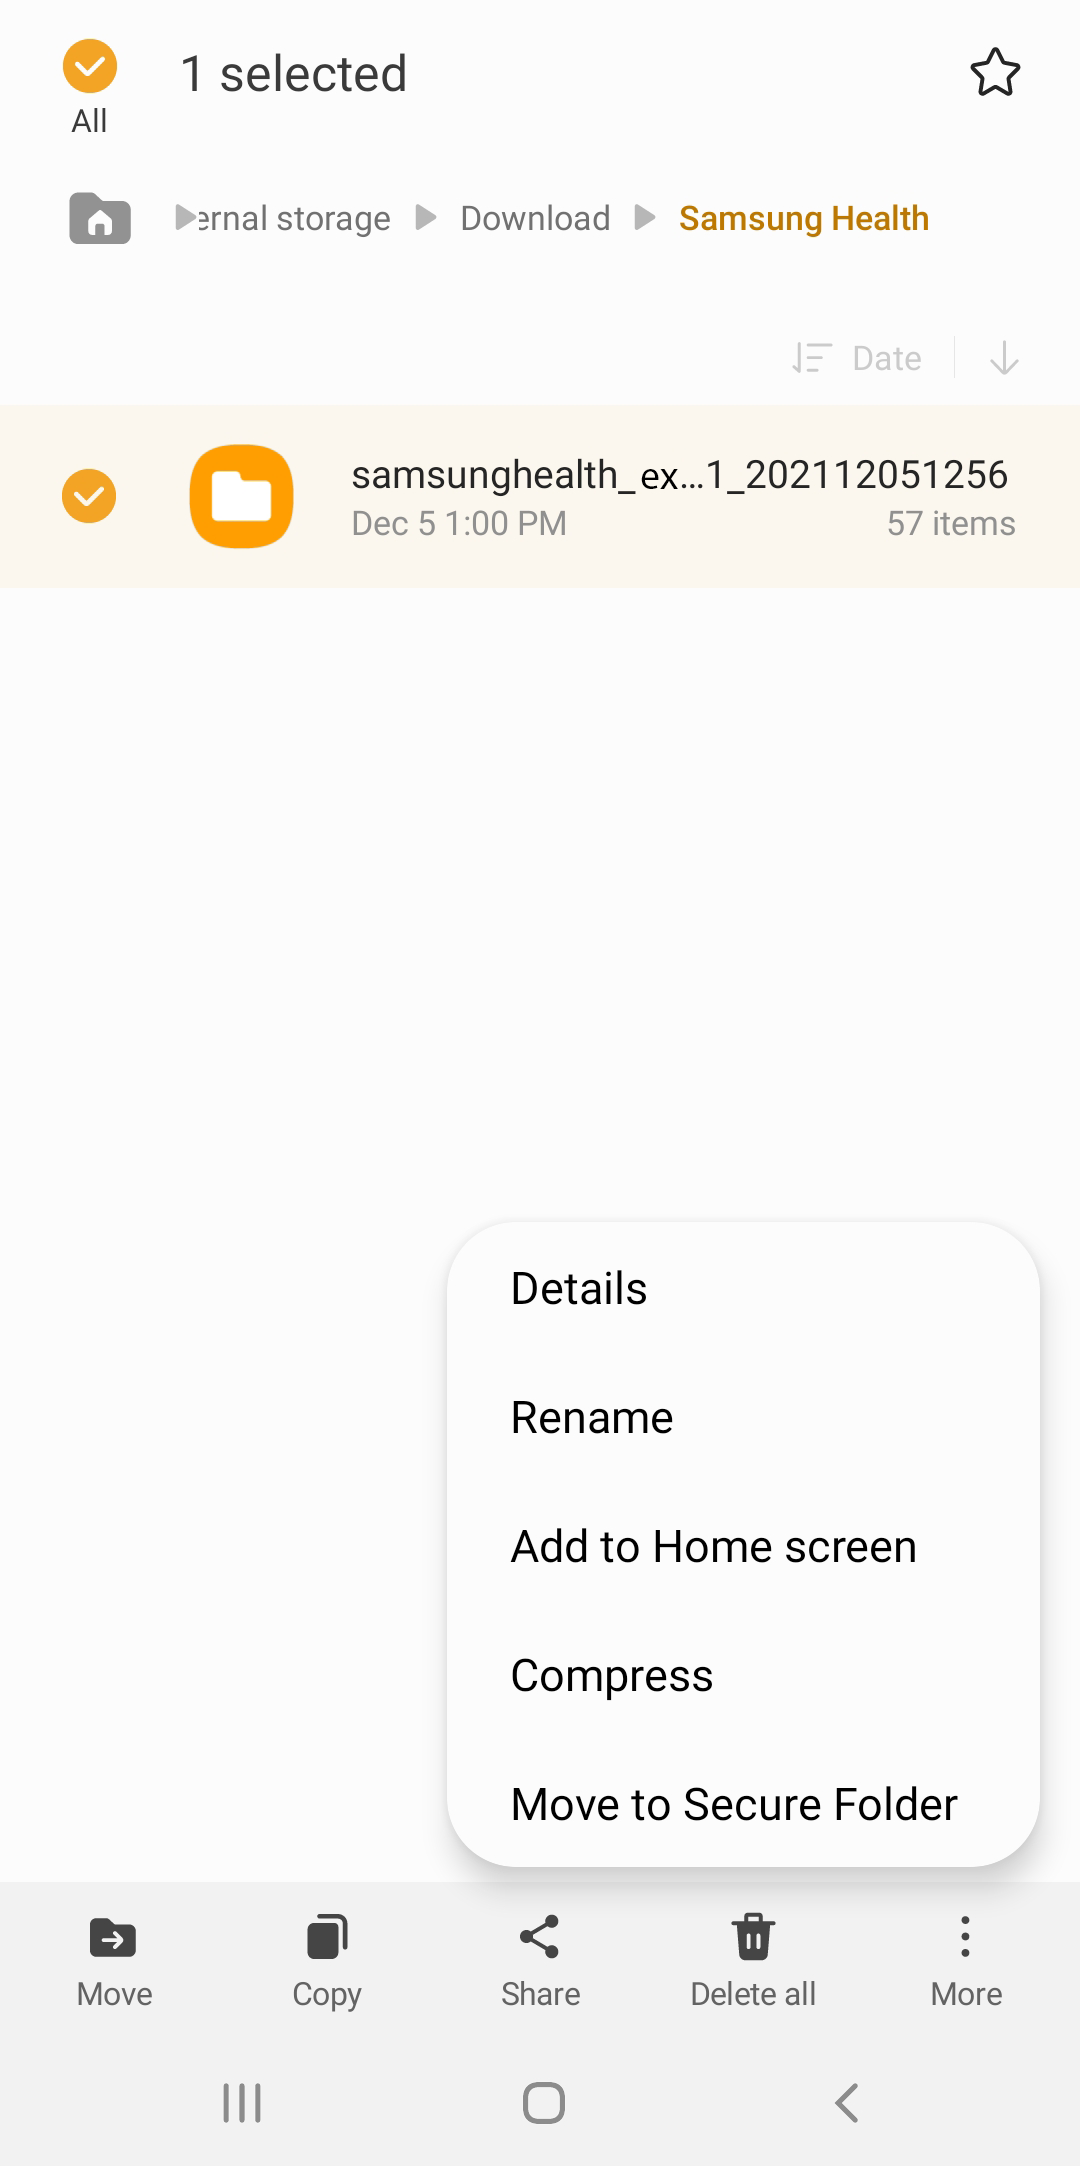
Then upload the file to the computer running Zeppelin. I upload it to OneDrive, then SFTP it to the server, then extract it into a folder
Working with the Data
The export should contain a number of interesting files in the main directory along with the json and files directories. The main files are CSV formatted.
| File Name | Doc Link | Notes |
|---|---|---|
| com.samsung.health.ecg.{ts}.csv | ||
| com.samsung.health.floors_climbed.{ts}.csv | Link | |
| com.samsung.health.food_info.{ts}.csv | ||
| com.samsung.health.food_intake.{ts}.csv | ||
| com.samsung.health.height.{ts}.csv | ||
| com.samsung.health.nutrition.{ts}.csv | ||
| com.samsung.health.sleep_stage.{ts}.csv | Link | |
| com.samsung.health.user_profile.{ts}.csv | ||
| com.samsung.health.water_intake.{ts}.csv | Link | |
| com.samsung.health.weight.{ts}.csv | Link | |
| com.samsung.shealth.activity.day_summary.{ts}.csv | ||
| com.samsung.shealth.activity.goal.{ts}.csv | ||
| com.samsung.shealth.activity_level.{ts}.csv | ||
| com.samsung.shealth.best_records.{ts}.csv | ||
| com.samsung.shealth.blood_pressure.{ts}.csv | Link | |
| com.samsung.shealth.breathing.{ts}.csv | ||
| com.samsung.shealth.caloric_balance_goal.{ts}.csv | ||
| com.samsung.shealth.calories_burned.details.{ts}.csv | ||
| com.samsung.shealth.exercise.{ts}.csv | ||
| com.samsung.shealth.exercise.weather.{ts}.csv | ||
| com.samsung.shealth.floor_goal.{ts}.csv | ||
| com.samsung.shealth.food_favorite.{ts}.csv | ||
| com.samsung.shealth.food_frequent.{ts}.csv | ||
| com.samsung.shealth.food_goal.{ts}.csv | ||
| com.samsung.shealth.goal.{ts}.csv | ||
| com.samsung.shealth.goal_history.{ts}.csv | ||
| com.samsung.shealth.insight.milestones.{ts}.csv | ||
| com.samsung.shealth.library_subscription.{ts}.csv | ||
| com.samsung.shealth.permission.{ts}.csv | ||
| com.samsung.shealth.preferences.{ts}.csv | ||
| com.samsung.shealth.report.{ts}.csv | ||
| com.samsung.shealth.rewards.{ts}.csv | ||
| com.samsung.shealth.sleep.{ts}.csv | Link | |
| com.samsung.shealth.sleep_combined.{ts}.csv | ||
| com.samsung.shealth.sleep_data.{ts}.csv | ||
| com.samsung.shealth.sleep_goal.{ts}.csv | ||
| com.samsung.shealth.social.friends.{ts}.csv | ||
| com.samsung.shealth.social.leaderboard.{ts}.csv | ||
| com.samsung.shealth.social.public_challenge.{ts}.csv | ||
| com.samsung.shealth.social.public_challenge.detail.{ts}.csv | ||
| com.samsung.shealth.social.public_challenge.extra.{ts}.csv | ||
| com.samsung.shealth.social.public_challenge.history.{ts}.csv | ||
| com.samsung.shealth.social.service_status.{ts}.csv | ||
| com.samsung.shealth.stand_day_summary.{ts}.csv | ||
| com.samsung.shealth.step_daily_trend.{ts}.csv | Link | |
| com.samsung.shealth.stress.{ts}.csv | ||
| com.samsung.shealth.stress.base_histogram.{ts}.csv | ||
| com.samsung.shealth.stress.histogram.{ts}.csv | ||
| com.samsung.shealth.tip.{ts}.csv | ||
| com.samsung.shealth.tracker.heart_rate.{ts}.csv | ||
| com.samsung.shealth.tracker.oxygen_saturation.{ts}.csv | Link | |
| com.samsung.shealth.tracker.pedometer_day_summary.{ts}.csv | ||
| com.samsung.shealth.tracker.pedometer_recommendation.{ts}.csv | ||
| com.samsung.shealth.tracker.pedometer_step_count.{ts}.csv | Link | |
| files/ | Contains random files like your profile picture | |
| json/ | Contains the binned data which is higher resolution (e.g. minute level) data from workouts, sleep, etc. |
Notes:
Once the data is loaded and accessible to Zeppelin, create a new notebook. This first block of code provides some basic package imports for Pandas and charting.
| |
I define a few utility methods that help me load data from the different CSV files.
| |
The timestamps stored in time based fields are UTC time, but the time offset is in a separate column. This makes it hard to do certain kinds of investigations because you can’t see things like what time you go to bed on average if you travel around.
The following code provides a load method: load_file(), that can be used to correctly parse the dates.
| |
Analytics
Below I show a few different examples of how to load and visualize interesting data sets.
Sleep Data
Sleep data can be loaded with the following code. This produces two data frames: sleep_data and sleep_data_by_day. If take naps during the day/night, then you’ll get one record per nap + one record per sleep event. If you wake up at night and move around enough, then Samsung Health may create a separate sleep record for when you go back to sleep.
| |
With this, you can graph how many hours of sleep you get per night:
| |
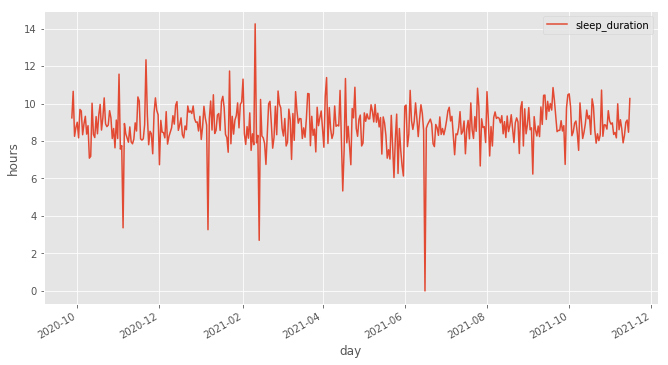
Hours of sleep per day. The dips near zero are likely data quality issues.
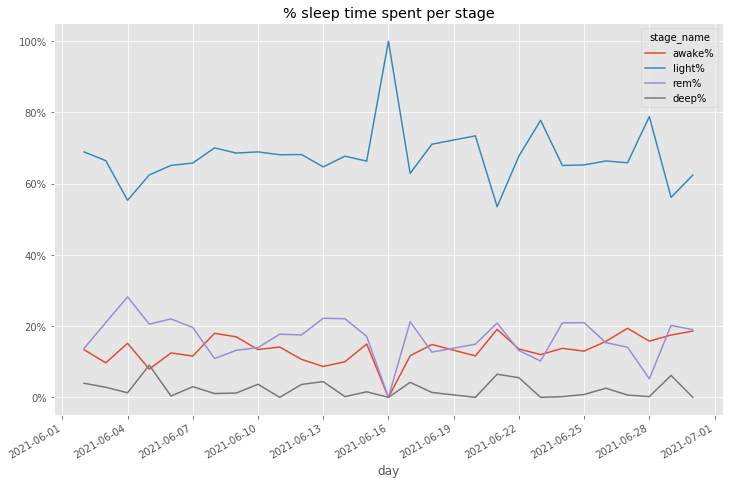
Sleep data is additionally broken out into a separate file for “sleep stages”. Sleep stages breaks down each night sleep into light, deep, REM, and awake stages. These stages help explain how good of a night’s sleep you’re getting and identify if you’re tossing and turning too much.
The following code will load sleep data into a data frame:
| |
There’s a couple interesting views of this data that I use. One is to project out the % of time in each stage over a time period to see if my sleep is changing.
| |
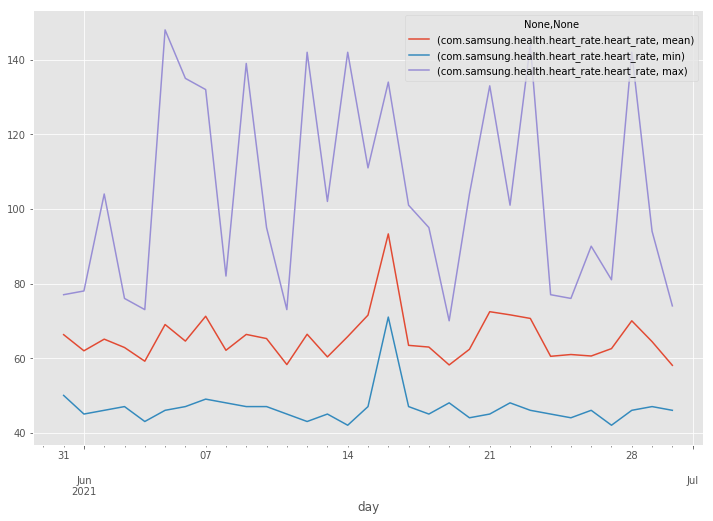
Heart Rate
Heart Rate data can be found in two locations: the main CSV file and in the binned JSON files. The JSON files contain higher resolution per minute. The main CSV file will contain either hourly summaries in the case of binned data or individual data points. My watch can be configured to collect heart rate data either continuously or intermittently. If it’s continuous, then you’ll see the binned data.
The following block will load the summary data and additionally load any binned data that is associated with an hour block into a data frame.
| |
- heart_rate contains just the summaries meaning either hourly buckets if you enable continuous heart rate monitoring or single samples if don’t
- heart_rate_full contains all available heart rate data at the lowest resolution available
Plot min, max, and average daily heart rate per day:
| |
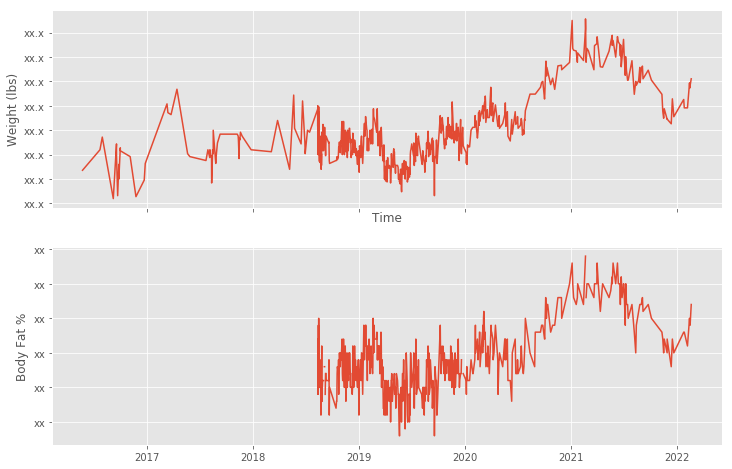
Weight
Tracking your weight is easy too. The weight is stored as kilograms. The code below concerts to pounds, but if you want to use kilograms remove the conversion line.
| |
That gives us a plot similar to the below:
Conclusion
Samsung Health gives a great export of data that you can analyze. I’ve given examples of how to leverage a few of the files. In the future, I plan to share some other analytics that I’ve done as I’ve worked to bring data analytics to my personal health.
If you’ve noticed any issues or have any other insights you’ve found, leave a comment below.